Statistical Tables | Right Down The Hall, For Now
| Trends at a Glance | |||
| (Single-family Homes) | |||
| Apr 26 | Mar 26 | Apr 25 | |
| Median Price: | $1,320,000 | $1,360,000 | $1,350,000 |
| Average Price: | $1,445,626 | $1,451,685 | $1,457,777 |
| Home Sales: | 669 | 584 | 675 |
| SP/LP Ratio: | 110.9% | 110.8% | 107.7% |
| Days on Market: | 21 | 18 | 20 |
| (Condos/Townhomes) | |||
| Apr 26 | Mar 26 | Apr 25 | |
| Median Price: | $725,000 | $690,000 | $737,500 |
| Average Price: | $726,003 | $737,493 | $782,416 |
| Condo Sales: | 211 | 202 | 224 |
| SP/LP Ratio: | 100.6% | 102.0% | 101.6% |
| Days on Market: | 33 | 40 | 31 |
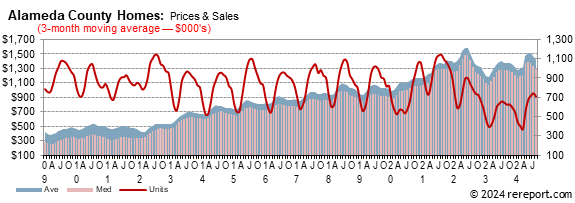
Sales of single-family, re-sale homes fell 0.9% from last year. There were 669
homes sold in Alameda County last month. The average since 2000 is 921.
The average sales price for
single-family, re-sale homes fell
0.8%
year-over-year.
It was down 0.4% from March.
The median sales price for
single-family, re-sale homes was down 2.2% year-over-year.
It was down 2.9% from March.
The sales price to list price ratio rose from 110.8% to 110.9%.
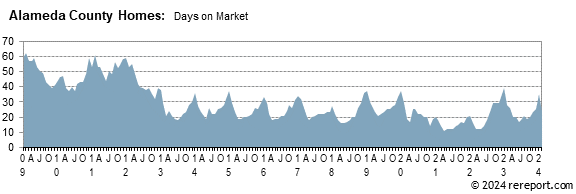
Homes sold in twenty-one days. This is the time from being listed to going under
contract.
The average sales price for condos was down 7.2% year-over-year. It was down
1.6% from March. The median sales price was down 1.7% year-over-year but it was
up 5.1% month-over-month.
The sales price to list price ratio for condos fell from 102% to 100.6%.
Condo sales were down 5.8% from last year. There were 211 condos sold.
Condos sold on average in thirty-three days.
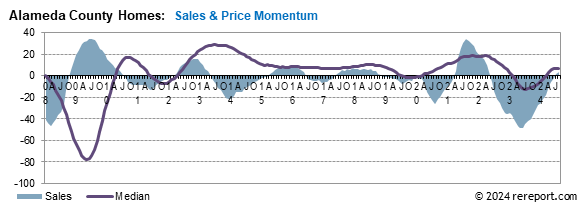
Momentum Statistics
Sales momentum…
for
single-family homes stayed at –2.5.
Pricing momentum…
for single-family homes rose 0.1 of a point to -1.5.
Our momentum statistics are based on 12-month moving averages to eliminate
monthly and seasonal variations.
This is an extraordinarily tough market for buyers. It's important to be calm
and realistic. If you don't know what to do or where to begin, give me a call
and let's discuss your situation and your options.
If you’re looking to sell, call me for a comprehensive Comparative Market
Analysis.
Our momentum statistics are based on 12-month moving averages to eliminate monthly and seasonal variations.
This is an extraordinarily tough market for buyers. It's important to be calm and realistic. If you don't know what to do or where to begin, give me a call and let's discuss your situation and your options.
If you’re looking to sell, call me for a comprehensive Comparative Market Analysis.
the blue area shows momentum for home sales while the purple line shows momentum for pending sales of single-family, re-sale homes. The purple line shows momentum for the median price.
This is an extraordinarily tough market for buyers. It's important to be calm and realistic. If you don't know what to do or where to begin, give me a call and let's discuss your situation and your options.


The real estate market is very hard to generalize. It is a market made up of many micro markets. For complete information on a particular neighborhood or property, call me.
If I can help you devise a strategy, call or click the buying or selling link in the menu to the left.
Complete monthly sales statistics for the Alameda County are below. Monthly graphs are available for each city in the county.
| April Sales Statistics | |||||||||||
| (Single-family Homes) | |||||||||||
| Prices | Unit | Change from last year | Change from last month | ||||||||
| Area | Median | Average | Sales | DOM | SP/LP | Median | Average | Sales | Median | Average | Sales |
| County | $1,320,000 | $1,445,626 | 669 | 21 | 110.9% | -2.2% | -0.8% | -0.9% | -2.9% | -0.4% | 14.6% |
| Alameda | $1,400,000 | $1,465,834 | 25 | 35 | 105.2% | -4.0% | -2.4% | -21.9% | 16.7% | -7.7% | 127.3% |
| Albany | $1,575,000 | $1,511,457 | 9 | 35 | 114.1% | 32.9% | 18.8% | 28.6% | 18.9% | 7.1% | 0.0% |
| Berkeley | $1,700,000 | $1,878,223 | 59 | 40 | 103.5% | -7.4% | -7.1% | -3.3% | 5.9% | 4.9% | 18.0% |
| Castro Valley | $1,200,000 | $1,213,387 | 31 | 37 | 102.6% | -10.3% | -12.9% | -6.1% | -9.0% | -0.3% | 14.8% |
| Dublin | $1,530,000 | $1,696,148 | 27 | 42 | 103.7% | -7.3% | 0.3% | -3.6% | -7.3% | 1.5% | 8.0% |
| Fremont | $1,875,000 | $1,960,895 | 83 | 41 | 109.6% | 7.1% | -0.3% | -8.8% | 7.1% | 5.8% | 15.3% |
| Hayward | $980,000 | $1,139,164 | 51 | 46 | 106.0% | 7.8% | 11.5% | 2.0% | 2.1% | 6.8% | 13.3% |
| Livermore | $1,330,000 | $1,355,558 | 57 | 44 | 102.2% | 0.0% | -12.1% | -8.1% | 7.5% | -3.8% | 1.8% |
| Newark | $1,618,000 | $1,620,238 | 21 | 50 | 107.5% | 14.7% | 9.2% | 0.0% | 8.5% | 3.8% | -4.5% |
| Oakland | $975,000 | $1,083,540 | 189 | 55 | 112.3% | 1.0% | -4.1% | -4.1% | -11.4% | -13.0% | 16.0% |
| Piedmont | $2,725,000 | $3,276,029 | 14 | 24 | 110.6% | 1.7% | 7.0% | 180.0% | -9.2% | 14.8% | 16.7% |
| Pleasanton | $1,762,500 | $1,989,487 | 30 | 35 | 101.9% | 4.6% | -0.7% | -30.2% | 15.2% | 1.1% | 11.1% |
| San Leandro | $885,000 | $962,668 | 34 | 48 | 105.5% | -2.5% | -1.2% | 25.9% | 5.4% | 8.7% | 3.0% |
| San Lorenzo | $820,000 | $809,818 | 11 | 35 | 104.6% | -0.6% | -1.3% | -15.4% | 0.0% | -1.8% | 0.0% |
| Union City | $1,405,000 | $1,469,323 | 24 | 41 | 108.1% | -9.4% | -4.1% | 14.3% | -4.1% | 0.4% | 20.0% |
| April Sales Statistics | |||||||||||
| (Condos/Town Homes) | |||||||||||
| Prices | Unit | Change from last year | Change from last month | ||||||||
| Median | Average | Sales | DOM | SP/LP | Median | Average | Sales | Median | Average | Sales | |
| County | $725,000 | $726,003 | 211 | 33 | 100.6% | -1.7% | -7.2% | -5.8% | -1.6% | 5.1% | 4.5% |
| Alameda | $770,000 | $745,095 | 19 | 47 | 100.8% | -12.0% | -9.6% | 72.7% | -18.3% | -15.8% | 11.8% |
| Albany | $705,444 | $705,444 | 2 | 46 | 101.6% | 76.8% | 55.7% | -33.3% | 39.7% | 39.7% | 100.0% |
| Berkeley | $960,000 | $1,085,861 | 8 | 27 | 108.2% | 17.1% | 25.0% | -20.0% | 11.0% | 26.3% | 14.3% |
| Castro Valley | $810,000 | $836,143 | 7 | 39 | 102.7% | -9.0% | 4.1% | 40.0% | 48.9% | 56.5% | 16.7% |
| Dublin | $965,000 | $908,809 | 19 | 52 | 99.0% | -4.9% | -6.4% | 11.8% | 3.7% | 17.0% | 46.2% |
| Emeryville | $420,000 | $435,875 | 12 | 57 | 99.3% | 9.1% | 4.9% | 9.1% | 9.7% | 25.7% | 20.0% |
| Fremont | $825,000 | $876,667 | 30 | 52 | 101.1% | -14.9% | -7.3% | -14.3% | -0.5% | 13.3% | -9.1% |
| Hayward | $620,000 | $629,100 | 15 | 53 | 98.9% | -21.0% | -13.3% | -11.8% | -5.7% | -6.7% | -46.4% |
| Livermore | $735,000 | $735,716 | 19 | 92 | 97.8% | -8.9% | 0.5% | 58.3% | 8.7% | 0.7% | 18.8% |
| Newark | $835,000 | $815,208 | 12 | 53 | 99.9% | 5.7% | -7.4% | 50.0% | 7.1% | 15.2% | 20.0% |
| Oakland | $560,000 | $592,802 | 43 | 71 | 101.0% | 1.3% | -1.0% | 26.5% | -7.2% | 0.0% | -4.4% |
| Pleasanton | $705,000 | $696,182 | 11 | 51 | 99.4% | -26.2% | -26.3% | -8.3% | -19.3% | -15.1% | 37.5% |
| San Leandro | $551,500 | $537,000 | 8 | 108 | 100.3% | -12.9% | -17.3% | 100.0% | -0.4% | 2.3% | 300.0% |
| Union City | $680,000 | $606,500 | 6 | 46 | 103.8% | 23.6% | -13.0% | 20.0% | -18.1% | -10.2% | 0.0% |
May 1, 2026 --
Sometime in the middle of next month, it's going to be a new day for the Fed, as
Kevin Warsh will become Chair of the Federal Reserve, and will take the helm of
the Federal Open Marked Committee, the body charged with evaluating economic
conditions and setting the course for monetary policy. While such a changeover
is fairly routine, what's not routine is for the former Chair of the committee
to remain with the Fed. This week, we learned that current Fed Chair Jerome
Powell intends to do just that, returning to the Governor's seat he held before
being elevated to lead the Fed back in 2018.
Some eight years ago, Mr. Powell succeeded then-Chair Janet Yellen, someone he
had worked with for six years before she departed. At his press conference, he
noted that "we were sitting down the hall from each other," and the transition
at that time saw him elevated as she exited. In Chair Powell's words, the
upcoming process will be 'a very different thing" than what took place back
then. Mr. Powell will move back to a position right down the hall again, and
will remain there "for a period of time to be determined." While he remains, Mr.
Powell pledged to be a "low profile" Governor.
Aside from the transition drama and what it may mean for the Fed going forward,
the FOMC voted this week to hold policy rates steady again, leaving the federal
funds rate with a range of 3.5% to 3.75%. All but one voting member agreed with
the decision to remain pat; Mr. Miran again agitated for lower rates, as he has
done since joining the board last September. While his was the only dissent in
terms of policy action, three other FOMC members didn't agree with the implicit
message in the meeting-closing statement that the next move by the FOMC would
likely be a cut in interest rates. Beth M. Hammack, Neel Kashkari and Lorie K.
Logan all preferred a more balanced statement, suggesting that policy rates
might have an equal chance of remaining the same or even being lifted in the
foreseeable future.
The housing market may not be on great footing -- Mr. Powell characterized it as
having remained "weak" -- but there was a sizable upturn in housing starts in
March anyway. A 10.8% increase compared to February lifted overall housing
starts to a 1.502 million annualized pace, Single-family starts rose to a 1.032
million rate, the fastest pace of construction initiation for one-family
dwellings in more than a year. Multi-family construction also flared higher,
moving up from 415K annual units in February to 470,000 for March. However,
while the present looks great, the future is considerably less bright. Permits
for future building activity declined by 10.8%, with new permits for
single-family homes falling 3.8% to 895,000 annualized units expected to be
started, while multi-unit building permits declined 21.5%.
Applications for mortgage credit slid by 1.6% in the week of April 24. The
Mortgage Bankers Association reported that requests for funds to purchase homes
managed to increase by 1.2% for the week, but those to refinance existing
mortgages dropped off by 4.4%. Mortgage rates have been fairly well-behaved
given inflation concerns and upward pressure on longer-term interest rates, but
they aren't currently at a place that supports a faster pace of homebuying or
one that increases opportunities for homeowners to refinance. As such, sluggish
activity is about all that can be expected.
This page is copyrighted by https://rereport.com. All rights are reserved.