
| Clayton | ||||||||
| (Single Family Homes) | ||||||||
| Prices | Other | % Change from Year Before | ||||||
| Average | Median | Sold | DOM | SP/LP | Average | Median | Sold | |
| 2012 | $546,363 | $510,000 | 161 | 46 | 99.6% | |||
| 2013 | $637,635 | $626,000 | 146 | 23 | 100.6% | 16.7% | 22.7% | -9.3% |
| 2014 | $679,977 | $658,444 | 146 | 33 | 99.8% | 6.6% | 5.2% | 0.0% |
| 2015 | $725,103 | $720,000 | 137 | 28 | 100.4% | 6.6% | 9.3% | -6.2% |
| 2016 | $754,415 | $749,000 | 144 | 30 | 99.9% | 4.0% | 4.0% | 5.1% |
| 2017 | $786,933 | $780,000 | 165 | 29 | 100.8% | 4.3% | 4.1% | 14.6% |
| 2018 | $824,036 | $815,000 | 157 | 24 | 100.0% | 4.7% | 4.5% | -4.8% |
| 2019 | $886,913 | $853,500 | 160 | 35 | 98.8% | 7.6% | 4.7% | 1.9% |
| 2020 | $930,997 | $905,000 | 148 | 18 | 101.9% | 5.0% | 6.0% | -7.5% |
| 2021 | $1,109,606 | $1,080,000 | 163 | 12 | 107.8% | 19.2% | 19.3% | 10.1% |
| 2022 | $1,217,028 | $1,197,500 | 124 | 18 | 106.5% | 9.7% | 10.9% | -23.9% |
| 2023 | $1,188,964 | $1,150,000 | 111 | 26 | 101.9% | -2.3% | -4.0% | -10.5% |
| 2024 | $1,241,894 | $1,199,500 | 86 | 24 | 101.9% | 4.5% | 4.3% | -22.5% |
| Clayton | ||||||||
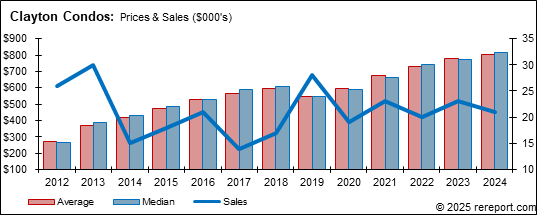
| (Condos/Town Homes) | ||||||||
| Prices | Other | % Change from Year Before | ||||||
| Average | Median | Sold | DOM | SP/LP | Average | Median | Sold | |
| 2012 | $268,548 | $265,250 | 26 | 64 | 98.9% | |||
| 2013 | $367,745 | $385,550 | 30 | 16 | 103.5% | 36.9% | 45.4% | 15.4% |
| 2014 | $420,730 | $429,000 | 15 | 14 | 100.5% | 14.4% | 11.3% | -50.0% |
| 2015 | $474,111 | $485,000 | 18 | 37 | 101.3% | 12.7% | 13.1% | 20.0% |
| 2016 | $526,567 | $530,000 | 21 | 18 | 101.5% | 11.1% | 9.3% | 16.7% |
| 2017 | $565,357 | $591,000 | 14 | 29 | 100.0% | 7.4% | 11.5% | -33.3% |
| 2018 | $594,486 | $609,000 | 17 | 18 | 100.8% | 5.2% | 3.0% | 21.4% |
| 2019 | $545,857 | $549,000 | 28 | 32 | 99.6% | -8.2% | -9.9% | 64.7% |
| 2020 | $596,789 | $592,000 | 19 | 21 | 100.5% | 9.3% | 7.8% | -32.1% |
| 2021 | $674,413 | $660,000 | 23 | 11 | 105.2% | 13.0% | 11.5% | 21.1% |
| 2022 | $731,313 | $740,000 | 20 | 12 | 104.5% | 8.4% | 12.1% | -13.0% |
| 2023 | $776,777 | $770,000 | 23 | 16 | 100.9% | 6.2% | 4.1% | 15.0% |
| 2024 | $802,105 | $815,000 | 21 | 23 | 100.8% | 3.3% | 5.8% | -8.7% |
This page is copyrighted by http://rereport.com. All rights are reserved.