
The average sales price for single-family, re-sale
homes peaked at $1,307,407 in May. It ended the year at $1,125,899. The median
price peaked at $935,000 in April. It ended the year at $868,000. The average
sales price was up 4.1% compared to 2023. The median price was up 2.8%.
Sales of single-family, re-sale homes were up 8.1%
from the year before. There were 7,400 homes sold in Alameda County in 2022.
After peaking at 104.1% in April, the sales price to
list price ratio, or what buyers paid divided by what sellers were asking, fell
steadily and it ended the year at 99.6%. For the year, the sales price to list
price ratio was 102.1%.
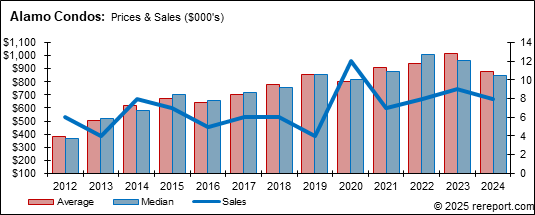
The sales price to list price ratio for condos peaked
in April at 101.9%. It closed the year at 98.8%. For the year, the sales price
to list price ratio was 100.5%.
The median sales price for re-sale condominiums peaked
at $658,180 in May. It ended the year at $600,000. The average price peaked in
May at $746,153. It ended the year at $655,618.
The average sales price was up 4.4% compared to 2023.
The median price was up 5.5%.
Condo sales were up 7.3% from 2023.
For assistance in this market, do not hesitate to
contact me. If you are thinking of selling, I can provide a free comparative
market analysis.
| Contra Costa County | ||||||||
| (Single Family Homes) | ||||||||
| Prices | Other | % Change from Year Before | ||||||
| Average | Median | Sold | DOM | SP/LP | Average | Median | Sold | |
| 2012 | $435,703 | $316,000 | 12,085 | 45 | 99.6% | |||
| 2013 | $608,659 | $480,000 | 9,217 | 27 | 100.0% | 39.7% | 51.9% | -23.7% |
| 2014 | $669,473 | $520,000 | 9,158 | 30 | 101.1% | 10.0% | 8.3% | -0.6% |
| 2015 | $696,559 | $538,345 | 10,755 | 29 | 101.5% | 4.0% | 3.5% | 17.4% |
| 2016 | $711,818 | $547,000 | 10,885 | 30 | 101.0% | 2.2% | 1.6% | 1.2% |
| 2017 | $777,197 | $610,000 | 11,337 | 27 | 101.5% | 9.2% | 11.5% | 4.2% |
| 2018 | $829,055 | $650,000 | 10,869 | 27 | 101.5% | 6.7% | 6.6% | -4.1% |
| 2019 | $845,605 | $660,000 | 10,635 | 32 | 100.7% | 2.0% | 1.5% | -2.2% |
| 2020 | $952,823 | $750,000 | 9,886 | 24 | 102.1% | 12.7% | 13.6% | -7.0% |
| 2021 | $1,142,504 | $889,888 | 11,871 | 15 | 107.9% | 19.9% | 18.7% | 20.1% |
| 2022 | $1,230,819 | $910,000 | 8,146 | 21 | 105.9% | 7.7% | 2.3% | -31.4% |
| 2023 | $1,145,541 | $851,001 | 6,845 | 27 | 101.7% | -6.9% | -6.5% | -16.0% |
| 2024 | $1,191,943 | $875,000 | 7,400 | 28 | 102.1% | 4.1% | 2.8% | 8.1% |
The charts below have the prices in the thousands.
| Contra Costa County | ||||||||
| (Condos/Town Homes) | ||||||||
| Prices | Other | % Change from Year Before | ||||||
| Average | Median | Sold | DOM | SP/LP | Average | Median | Sold | |
| 2012 | $241,788 | $190,000 | 3,027 | 45 | 100.2% | |||
| 2013 | $350,973 | $311,000 | 2,361 | 22 | 103.0% | 45.2% | 63.7% | -22.0% |
| 2014 | $404,949 | $375,000 | 2,438 | 27 | 100.8% | 15.4% | 20.6% | 3.3% |
| 2015 | $436,076 | $390,000 | 2,726 | 25 | 101.8% | 7.7% | 4.0% | 11.8% |
| 2016 | $462,979 | $411,000 | 2,669 | 26 | 101.0% | 6.2% | 5.4% | -2.1% |
| 2017 | $492,266 | $449,000 | 2,808 | 24 | 101.2% | 6.3% | 9.2% | 5.2% |
| 2018 | $536,158 | $479,000 | 2,706 | 22 | 102.1% | 8.9% | 6.7% | -3.6% |
| 2019 | $532,198 | $480,000 | 2,738 | 32 | 100.3% | -0.7% | 0.2% | 1.2% |
| 2020 | $560,132 | $505,000 | 2,459 | 29 | 100.4% | 5.2% | 5.2% | -10.2% |
| 2021 | $621,986 | $560,000 | 3,411 | 20 | 104.0% | 11.0% | 10.9% | 38.7% |
| 2022 | $684,605 | $590,000 | 2,250 | 20 | 104.8% | 10.1% | 5.4% | -34.0% |
| 2023 | $670,002 | $585,000 | 2,031 | 28 | 101.5% | -2.1% | -0.8% | -9.7% |
| 2024 | $699,570 | $617,000 | 2,179 | 35 | 100.5% | 4.4% | 5.5% | 7.3% |
This page is copyrighted by http://rereport.com. All rights are reserved.