Lafayette Annual Real Estate Trends
|
Lafayette |
|
(Single Family Homes) |
|
|
Prices |
Other |
% Change from Year Before |
| Average |
Median |
Sold |
DOM |
SP/LP |
Average |
Median |
Sold |
|
2012 |
$1,043,540 |
$935,000 |
295 |
37 |
98.7% |
|
|
|
|
2013 |
$1,242,130 |
$1,155,000 |
301 |
35 |
97.8% |
19.0% |
23.5% |
2.0% |
|
2014 |
$1,361,059 |
$1,200,000 |
287 |
25 |
103.4% |
9.6% |
3.9% |
-4.7% |
|
2015 |
$1,532,387 |
$1,367,500 |
336 |
26 |
102.4% |
12.6% |
14.0% |
17.1% |
|
2016 |
$1,506,811 |
$1,350,000 |
263 |
30 |
101.5% |
-1.7% |
-1.3% |
-21.7% |
|
2017 |
$1,619,514 |
$1,442,000 |
314 |
25 |
102.2% |
7.5% |
6.8% |
19.4% |
|
2018 |
$1,736,238 |
$1,482,000 |
305 |
22 |
102.0% |
7.2% |
2.8% |
-2.9% |
|
2019 |
$1,784,729 |
$1,600,000 |
293 |
29 |
101.6% |
2.8% |
8.0% |
-3.9% |
|
2020 |
$1,914,737 |
$1,750,000 |
293 |
22 |
101.7% |
7.3% |
9.4% |
0.0% |
|
2021 |
$2,053,608 |
$1,900,000 |
384 |
16 |
107.6% |
7.3% |
8.6% |
31.1% |
| 2022 |
$2,496,740 |
$2,075,784 |
290 |
17 |
107.5% |
21.6% |
9.3% |
-24.5% |
| 2023 |
$2,241,823 |
$1,900,000 |
220 |
26 |
100.5% |
-10.2% |
-8.5% |
-24.1% |
| 2024 |
$2,320,166 |
$1,975,000 |
267 |
23 |
102.6% |
3.5% |
3.9% |
21.4% |

|
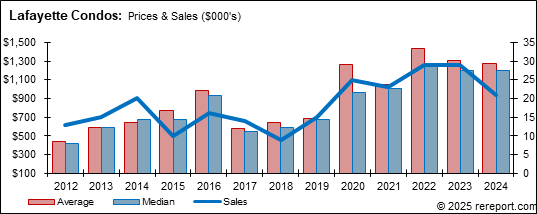
Lafayette |
|
(Condos/Town Homes) |
|
|
Prices |
Other |
% Change from Year Before |
| Average |
Median |
Sold |
DOM |
SP/LP |
Average |
Median |
Sold |
|
2012 |
$442,731 |
$420,000 |
13 |
44 |
99.4% |
|
|
|
|
2013 |
$586,690 |
$588,000 |
15 |
15 |
103.6% |
32.5% |
40.0% |
15.4% |
|
2014 |
$646,840 |
$670,000 |
20 |
30 |
99.9% |
10.3% |
13.9% |
33.3% |
|
2015 |
$774,800 |
$677,000 |
10 |
13 |
102.0% |
19.8% |
1.0% |
-50.0% |
|
2016 |
$987,639 |
$935,000 |
16 |
20 |
101.0% |
27.5% |
38.1% |
60.0% |
|
2017 |
$577,571 |
$548,500 |
14 |
24 |
110.1% |
8.2% |
9.7% |
-33.3% |
|
2018 |
$639,985 |
$590,000 |
9 |
22 |
112.2% |
10.8% |
7.6% |
-35.7% |
|
2019 |
$690,267 |
$675,000 |
15 |
40 |
103.4% |
7.9% |
14.4% |
66.7% |
|
2020 |
$1,258,414 |
$960,000 |
25 |
26 |
100.9% |
82.3% |
42.2% |
66.7% |
|
2021 |
$1,049,239 |
$1,005,000 |
23 |
27 |
103.4% |
-16.6% |
4.7% |
-8.0% |
| 2022 |
$1,430,731 |
$1,250,000 |
29 |
24 |
101.6% |
36.4% |
24.4% |
26.1% |
| 2023 |
$1,306,757 |
$1,200,000 |
29 |
48 |
98.1% |
-8.7% |
-4.0% |
0.0% |
| 2024 |
$1,274,389 |
$1,202,000 |
21 |
90 |
100.0% |
-2.5% |
0.2% |
-27.6% |
DEFINITIONS
- Med. Price
- Median Price is that at which 50% of properties sold were above that price
and 50% were below.
- Ave. Price
- Average Price is the sum of all prices divided by the number of sales.
- Ave. DOM
- Average Days on Market is the average time it took to sell all properties.
- Newly Listed
- How many properties came on the market in the given time period.
This page
is copyrighted by
http://rereport.com. All rights are reserved.