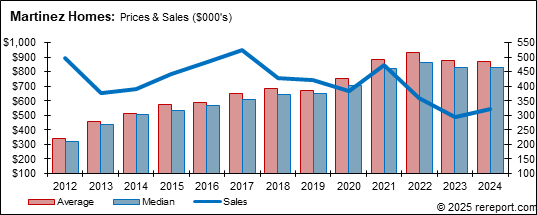
| Martinez | ||||||||
| (Single Family Homes) | ||||||||
| Prices | Other | % Change from Year Before | ||||||
| Average | Median | Sold | DOM | SP/LP | Average | Median | Sold | |
| 2012 | $340,879 | $321,780 | 497 | 47 | 99.7% | |||
| 2013 | $455,572 | $436,000 | 376 | 25 | 101.6% | 33.6% | 35.5% | -24.3% |
| 2014 | $514,022 | $505,000 | 389 | 25 | 100.3% | 12.8% | 15.8% | 3.5% |
| 2015 | $571,005 | $534,150 | 441 | 29 | 100.3% | 11.1% | 5.8% | 13.4% |
| 2016 | $588,009 | $570,000 | 485 | 30 | 100.9% | 3.0% | 6.7% | 10.0% |
| 2017 | $648,553 | $610,000 | 525 | 29 | 100.7% | 10.3% | 7.0% | 8.2% |
| 2018 | $684,576 | $645,000 | 429 | 30 | 100.7% | 5.6% | 5.7% | -18.3% |
| 2019 | $672,863 | $649,900 | 423 | 30 | 100.3% | -1.7% | 0.8% | -1.4% |
| 2020 | $750,256 | $705,500 | 384 | 19 | 102.3% | 11.5% | 8.6% | -9.2% |
| 2021 | $880,826 | $825,000 | 474 | 15 | 106.1% | 17.4% | 16.9% | 23.4% |
| 2022 | $929,217 | $860,000 | 359 | 20 | 104.9% | 5.5% | 4.2% | -24.3% |
| 2023 | $874,079 | $829,900 | 295 | 22 | 101.7% | -5.9% | -3.5% | -17.8% |
| 2024 | $866,906 | $826,500 | 321 | 25 | 101.9% | -0.8% | -0.4% | 8.8% |
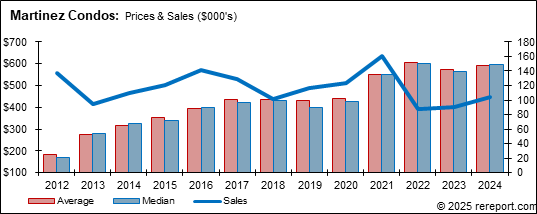
| Martinez | ||||||||
| (Condos/Town Homes) | ||||||||
| Prices | Other | % Change from Year Before | ||||||
| Average | Median | Sold | DOM | SP/LP | Average | Median | Sold | |
| 2012 | $181,419 | $171,780 | 137 | 55 | 100.2% | |||
| 2013 | $274,373 | $280,000 | 95 | 22 | 104.8% | 51.2% | 63.0% | -30.7% |
| 2014 | $317,425 | $325,000 | 110 | 29 | 100.2% | 15.7% | 16.1% | 15.8% |
| 2015 | $353,935 | $340,000 | 121 | 21 | 101.7% | 11.5% | 4.6% | 10.0% |
| 2016 | $393,003 | $398,000 | 142 | 21 | 101.7% | 11.0% | 17.1% | 17.4% |
| 2017 | $435,238 | $419,888 | 129 | 21 | 101.7% | 10.7% | 5.5% | -9.2% |
| 2018 | $437,662 | $430,000 | 102 | 24 | 100.7% | 0.6% | 2.4% | -20.9% |
| 2019 | $431,664 | $400,750 | 116 | 33 | 100.2% | -1.4% | -6.8% | 13.7% |
| 2020 | $440,961 | $425,000 | 124 | 19 | 101.4% | 2.2% | 6.1% | 6.9% |
| 2021 | $548,747 | $550,000 | 161 | 13 | 104.9% | 24.4% | 29.4% | 29.8% |
| 2022 | $605,851 | $600,000 | 87 | 18 | 104.0% | 10.4% | 9.1% | -46.0% |
| 2023 | $573,489 | $565,000 | 90 | 30 | 101.0% | -5.3% | -5.8% | 3.4% |
| 2024 | $592,156 | $597,000 | 104 | 44 | 99.8% | 3.3% | 5.7% | 15.6% |
This page is copyrighted by http://rereport.com. All rights are reserved.