Neighborhoods |
| Balboa Terrace |
| Diamond Heights |
| Forest Hill Extension |
| Forest Hill |
| Forest Knolls |
| Ingleside Terrace |
| Midtown Terrace |
| Miraloma Park |
| Monterey Heights |
| Mount Davidson Manor |
| Sherwood Forest |
| St. Francis Wood |
| Sunnyside |
| West Portal: |
| Westwood Highlands |
| Westwood Park |
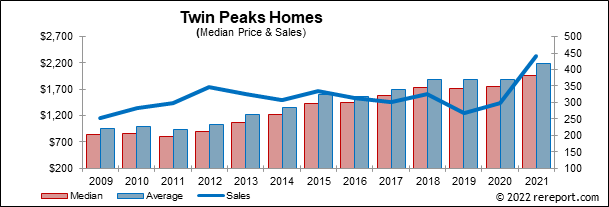
| Twin Peaks | |||||||||
| (Single Family Homes) | |||||||||
| Prices | Other | Percent Change | |||||||
| Average | Median | Sold | DOM | SP/LP | SP/OLP | Average | Median | Sold | |
| 2009 | $956,267 | $849,500 | 252 | 62 | 98.4% | 95.3% | |||
| 2010 | $990,242 | $855,000 | 284 | 60 | 100.4% | 98.0% | 3.6% | 0.6% | 12.7% |
| 2011 | $927,740 | $808,000 | 297 | 67 | 100.3% | 97.3% | -6.3% | -5.5% | 4.6% |
| 2012 | $1,029,043 | $900,000 | 346 | 50 | 103.0% | 101.4% | 10.9% | 11.4% | 16.5% |
| 2013 | $1,211,681 | $1,077,500 | 326 | 35 | 107.9% | 102.8% | 17.7% | 19.7% | -5.8% |
| 2014 | $1,361,799 | $1,222,500 | 308 | 26 | 112.4% | 111.9% | 12.4% | 13.5% | -5.5% |
| 2015 | $1,607,512 | $1,425,000 | 335 | 24 | 113.5% | 112.9% | 18.0% | 16.6% | 8.8% |
| 2016 | $1,555,737 | $1,439,800 | 315 | 29 | 109.9% | 109.0% | -3.2% | 1.0% | -6.0% |
| 2017 | $1,689,186 | $1,575,000 | 302 | 20 | 114.6% | 114.7% | 8.6% | 9.4% | -4.1% |
| 2018 | $1,894,290 | $1,735,000 | 325 | 22 | 114.3% | 114.0% | 12.1% | 10.2% | 7.6% |
| 2019 | $1,887,861 | $1,715,000 | 267 | 23 | 111.1% | 109.7% | -0.3% | -1.2% | -17.8% |
| 2020 | $1,893,629 | $1,750,000 | 297 | 23 | 106.6% | 105.4% | 0.3% | 2.0% | 11.2% |
| 2021 | $2,193,868 | $1,960,000 | 440 | 17 | 115.5% | 113.1% | 15.9% | 12.0% | 48.1% |
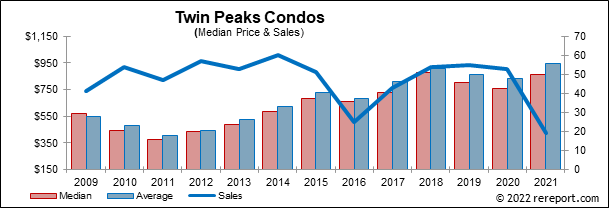
| Twin Peaks | |||||||||
| (Condos/Town Homes/Flats) | |||||||||
| Prices | Other | Percent Change | |||||||
| Average | Median | Sold | DOM | SP/LP | SP/OLP | Average | Median | Sold | |
| 2009 | $550,914 | $570,000 | 41 | 60 | 99.4% | 95.9% | |||
| 2010 | $478,139 | $439,500 | 54 | 91 | 98.0% | 92.8% | -13.2% | -22.9% | 31.7% |
| 2011 | $405,352 | $379,000 | 47 | 95 | 98.0% | 93.3% | -15.2% | -13.8% | -13.0% |
| 2012 | $441,625 | $435,000 | 57 | 94 | 100.7% | 98.7% | 8.9% | 14.8% | 21.3% |
| 2013 | $527,819 | $485,000 | 53 | 58 | 107.2% | 107.6% | 19.5% | 11.5% | -7.0% |
| 2014 | $619,762 | $587,000 | 60 | 31 | 108.1% | 107.9% | 17.4% | 21.0% | 13.2% |
| 2015 | $728,389 | $685,000 | 51 | 32 | 107.7% | 107.8% | 17.5% | 16.7% | -15.0% |
| 2016 | $679,181 | $660,000 | 25 | 49 | 105.6% | 104.8% | -6.8% | -3.6% | -51.0% |
| 2017 | $806,446 | $725,000 | 43 | 35 | 106.8% | 105.4% | 18.7% | 9.8% | 72.0% |
| 2018 | $905,528 | $877,000 | 54 | 34 | 106.8% | 105.6% | 12.3% | 21.0% | 25.6% |
| 2019 | $858,795 | $800,500 | 55 | 42 | 106.8% | 106.6% | -5.2% | -8.7% | 1.9% |
| 2020 | $835,586 | $755,000 | 53 | 46 | 101.5% | 100.3% | -2.7% | -5.7% | -3.6% |
| 2021 | $944,947 | $860,000 | 19 | 28 | 107.1% | 105.9% | 13.1% | 13.9% | -64.2% |
To keep on top of the market, subscribe to our free monthly newsletter by clicking the subscribe button at the bottom right.
Detailed information on homes or neighborhoods can be had by calling or e-mailing us. Or, fill out our Buying or Selling forms located in the menu to the left.
This page is copyrighted by https://rereport.com. All rights are reserved.