Neighborhoods |
| Cow Hollow |
| Marina |
| Pacific Heights |
| Presidio Heights |
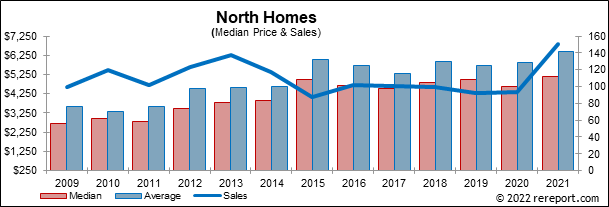
| North | |||||||||
| (Single Family Homes) | |||||||||
| Prices | Other | Percent Change | |||||||
| Average | Median | Sold | DOM | SP/LP | SP/OLP | Average | Median | Sold | |
| 2009 | $3,561,807 | $2,700,000 | 99 | 77 | 97.8% | 93.1% | |||
| 2010 | $3,327,340 | $2,962,500 | 120 | 57 | 97.0% | 94.1% | -6.6% | 9.7% | 21.2% |
| 2011 | $3,562,825 | $2,795,000 | 102 | 63 | 96.0% | 92.7% | 7.1% | -5.7% | -15.0% |
| 2012 | $4,513,371 | $3,500,000 | 123 | 70 | 97.0% | 90.6% | 26.7% | 25.2% | 20.6% |
| 2013 | $4,554,797 | $3,800,000 | 137 | 36 | 100.3% | 98.1% | 0.9% | 8.6% | 11.4% |
| 2014 | $4,629,430 | $3,905,000 | 117 | 37 | 102.3% | 100.2% | 1.6% | 2.8% | -14.6% |
| 2015 | $6,010,887 | $4,975,000 | 87 | 28 | 100.8% | 99.5% | 29.8% | 27.4% | -25.6% |
| 2016 | $5,706,051 | $4,700,000 | 102 | 46 | 99.6% | 96.5% | -5.1% | -5.5% | 17.2% |
| 2017 | $5,308,517 | $4,500,000 | 101 | 40 | 100.8% | 96.8% | -7.0% | -4.3% | -1.0% |
| 2018 | $5,928,993 | $4,815,000 | 100 | 29 | 100.1% | 98.2% | 11.7% | 7.0% | -1.0% |
| 2019 | $5,721,223 | $4,972,500 | 92 | 41 | 99.7% | 97.7% | -3.5% | 3.3% | -8.0% |
| 2020 | $5,890,501 | $4,630,000 | 94 | 42 | 94.9% | 92.2% | 3.0% | -6.9% | 2.2% |
| 2021 | $6,427,460 | $5,135,000 | 150 | 31 | 98.7% | 97.1% | 9.1% | 10.9% | 59.6% |
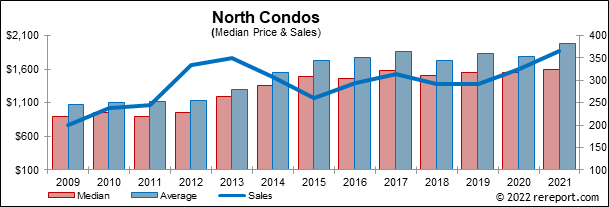
| North | |||||||||
| (Condos/Town Homes/Flats) | |||||||||
| Prices | Other | Percent Change | |||||||
| Average | Median | Sold | DOM | SP/LP | SP/OLP | Average | Median | Sold | |
| 2009 | $1,078,458 | $901,500 | 201 | 72 | 96.5% | 92.5% | |||
| 2010 | $1,098,841 | $954,500 | 238 | 71 | 97.3% | 94.4% | 1.9% | 5.9% | 18.4% |
| 2011 | $1,124,335 | $900,000 | 245 | 73 | 97.3% | 95.4% | 2.3% | -5.7% | 2.9% |
| 2012 | $1,139,866 | $960,000 | 335 | 56 | 101.3% | 99.9% | 1.4% | 6.7% | 36.7% |
| 2013 | $1,295,985 | $1,200,000 | 350 | 46 | 103.8% | 102.8% | 13.7% | 25.0% | 4.5% |
| 2014 | $1,554,383 | $1,350,000 | 308 | 32 | 105.8% | 104.8% | 19.9% | 12.5% | -12.0% |
| 2015 | $1,720,559 | $1,495,000 | 261 | 24 | 109.2% | 108.5% | 10.7% | 10.7% | -15.3% |
| 2016 | $1,774,699 | $1,457,000 | 293 | 34 | 103.2% | 102.2% | 3.1% | -2.5% | 12.3% |
| 2017 | $1,866,387 | $1,575,000 | 314 | 28 | 103.5% | 102.7% | 5.2% | 8.1% | 7.2% |
| 2018 | $1,725,033 | $1,497,500 | 292 | 25 | 104.8% | 103.6% | -7.6% | -4.9% | -7.0% |
| 2019 | $1,837,723 | $1,550,000 | 291 | 32 | 103.0% | 101.8% | 6.5% | 3.5% | -0.3% |
| 2020 | $1,782,325 | $1,548,000 | 326 | 38 | 99.3% | 96.5% | -3.0% | -0.1% | 12.0% |
To keep on top of the market, subscribe to our free monthly newsletter by clicking the subscribe button at the bottom right.
Detailed information on homes or neighborhoods can be had by calling or e-mailing us. Or, fill out our Buying or Selling forms located in the menu to the left.
This page is copyrighted by https://rereport.com. All rights are reserved.