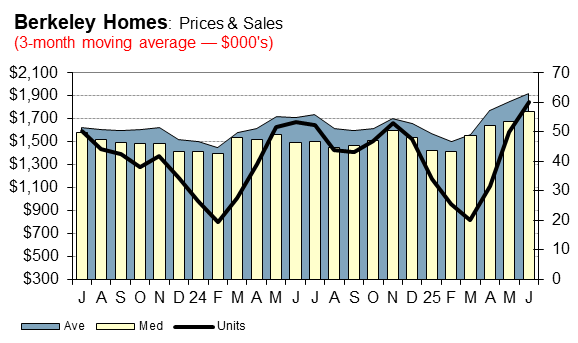
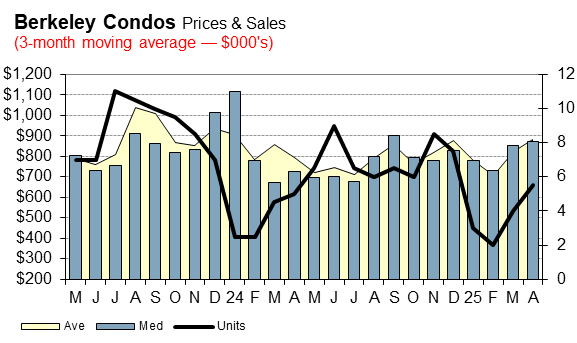
The following charts shows median and average price trends plus sales for single-family homes and condos. The chart uses a 3-month moving average to smooth out month-to-month fluctuations yet retain seasonal variations.
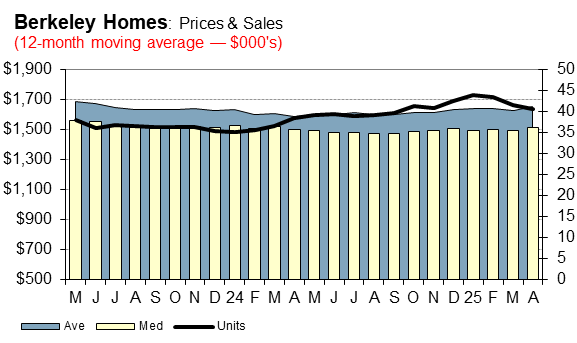
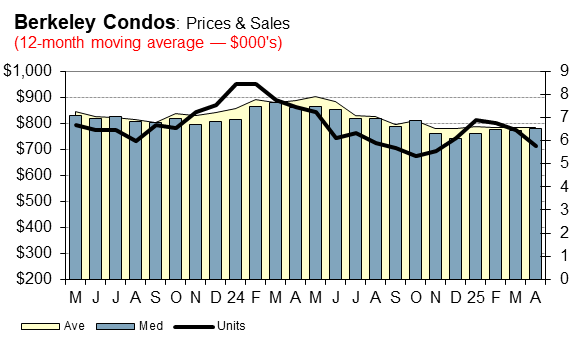
The next charts are the same as above but use a 12-month moving average to eliminate seasonal variation.