| Alamo | ||||||||
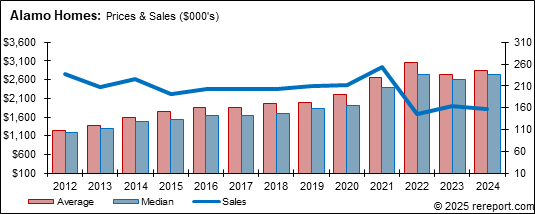
| (Single Family Homes) | ||||||||
| Prices | Other | % Change from Year Before | ||||||
| Average | Median | Sold | DOM | SP/LP | Average | Median | Sold | |
| 2012 | $1,244,560 | $1,176,250 | 238 | 66 | 97.5% | |||
| 2013 | $1,365,651 | $1,300,000 | 207 | 41 | 97.8% | 9.7% | 10.5% | -13.0% |
| 2014 | $1,594,138 | $1,480,000 | 225 | 38 | 99.1% | 16.7% | 13.8% | 8.7% |
| 2015 | $1,760,148 | $1,532,500 | 192 | 41 | 100.1% | 10.4% | 3.5% | -14.7% |
| 2016 | $1,845,722 | $1,637,050 | 202 | 43 | 98.9% | 4.9% | 6.8% | 5.2% |
| 2017 | $1,853,031 | $1,643,500 | 202 | 33 | 99.1% | 0.4% | 0.4% | 0.0% |
| 2018 | $1,953,672 | $1,700,000 | 203 | 38 | 97.5% | 5.4% | 3.4% | 0.5% |
| 2019 | $1,997,006 | $1,830,000 | 209 | 41 | 98.5% | 2.2% | 7.6% | 3.0% |
| 2020 | $2,196,534 | $1,912,500 | 213 | 31 | 97.9% | 10.0% | 4.5% | 1.9% |
| 2021 | $2,664,276 | $2,400,000 | 253 | 19 | 104.0% | 21.3% | 25.5% | 18.8% |
| 2022 | $3,060,730 | $2,750,000 | 145 | 20 | 102.6% | 14.9% | 14.6% | -42.7% |
| 2023 | $2,740,267 | $2,600,000 | 163 | 21 | 99.8% | -10.5% | -5.5% | 12.4% |
| 2024 | $2,843,220 | $2,725,000 | 157 | 29 | 98.9% | 3.8% | 4.8% | -3.7% |
| Alamo | ||||||||
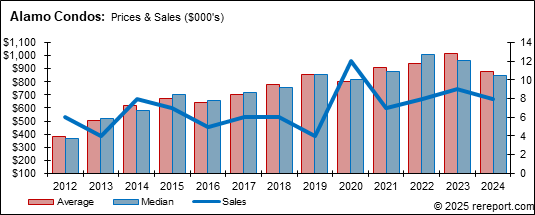
| (Condos/Town Homes) | ||||||||
| Prices | Other | % Change from Year Before | ||||||
| Average | Median | Sold | DOM | SP/LP | Average | Median | Sold | |
| 2012 | $384,167 | $366,000 | 6 | 37 | 101.7% | |||
| 2013 | $507,700 | $520,000 | 4 | 18 | 98.9% | 32.2% | 42.1% | -33.3% |
| 2014 | $619,500 | $577,500 | 8 | 16 | 102.5% | 22.0% | 11.1% | 100.0% |
| 2015 | $675,571 | $700,000 | 7 | 20 | 99.0% | 9.1% | 21.2% | -12.5% |
| 2016 | $641,563 | $656,000 | 5 | 43 | 98.4% | -5.0% | -6.3% | -28.6% |
| 2017 | $703,083 | $720,750 | 6 | 18 | 101.6% | 9.6% | 9.9% | 20.0% |
| 2018 | $778,292 | $760,000 | 6 | 17 | 100.9% | 10.7% | 5.4% | 0.0% |
| 2019 | $855,125 | $859,000 | 4 | 24 | 99.7% | 9.9% | 13.0% | -33.3% |
| 2020 | $803,412 | $815,000 | 12 | 27 | 100.0% | -6.0% | -5.1% | 200.0% |
| 2021 | $911,286 | $878,000 | 7 | 36 | 102.4% | 13.4% | 7.7% | -41.7% |
| 2022 | $940,625 | $1,007,500 | 8 | 36 | 107.5% | 3.2% | 14.7% | 14.3% |
| 2023 | $1,016,111 | $965,000 | 9 | 45 | 97.6% | 8.0% | -4.2% | 12.5% |
| 2024 | $882,125 | $845,500 | 8 | 58 | 98.8% | -13.2% | -12.4% | -11.1% |
This page is copyrighted by http://rereport.com. All rights are reserved.