
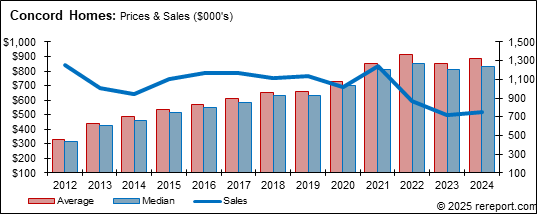
| Concord | ||||||||
| (Single Family Homes) | ||||||||
| Prices | Other | % Change from Year Before | ||||||
| Average | Median | Sold | DOM | SP/LP | Average | Median | Sold | |
| 2012 | $330,500 | $314,000 | 1,249 | 45 | 100.7% | |||
| 2013 | $441,784 | $425,000 | 1,007 | 23 | 102.8% | 33.7% | 35.4% | -19.4% |
| 2014 | $488,258 | $460,000 | 940 | 29 | 101.0% | 10.5% | 8.2% | -6.7% |
| 2015 | $533,089 | $514,900 | 1,107 | 25 | 101.2% | 9.2% | 11.9% | 17.8% |
| 2016 | $572,606 | $550,000 | 1,166 | 27 | 101.0% | 7.4% | 6.8% | 5.3% |
| 2017 | $614,186 | $585,000 | 1,173 | 23 | 101.8% | 7.3% | 6.4% | 0.6% |
| 2018 | $650,606 | $630,000 | 1,112 | 24 | 101.3% | 5.9% | 7.7% | -5.2% |
| 2019 | $656,524 | $635,000 | 1,133 | 25 | 101.0% | 0.9% | 0.8% | 1.9% |
| 2020 | $725,629 | $700,000 | 1,014 | 18 | 102.7% | 10.5% | 10.2% | -10.5% |
| 2021 | $850,796 | $810,000 | 1,241 | 13 | 107.3% | 17.2% | 15.7% | 22.4% |
| 2022 | $910,960 | $850,000 | 865 | 17 | 106.2% | 7.1% | 4.9% | -30.3% |
| 2023 | $851,564 | $813,340 | 715 | 21 | 102.3% | -6.5% | -4.3% | -17.3% |
| 2024 | $884,335 | $830,000 | 754 | 23 | 102.4% | 3.8% | 2.0% | 5.5% |
| Concord | ||||||||
| (Condos/Town Homes) | ||||||||
| Prices | Other | % Change from Year Before | ||||||
| Average | Median | Sold | DOM | SP/LP | Average | Median | Sold | |
| 2012 | $112,990 | $105,000 | 425 | 36 | 103.6% | |||
| 2013 | $184,474 | $175,500 | 252 | 24 | 106.1% | 63.3% | 67.1% | -40.7% |
| 2014 | $231,162 | $223,000 | 261 | 27 | 100.5% | 25.3% | 27.1% | 3.6% |
| 2015 | $259,806 | $250,000 | 335 | 27 | 102.1% | 12.4% | 12.1% | 28.4% |
| 2016 | $273,875 | $261,000 | 344 | 23 | 102.0% | 5.4% | 4.4% | 2.7% |
| 2017 | $318,819 | $310,000 | 365 | 17 | 103.2% | 16.4% | 18.8% | 6.1% |
| 2018 | $352,921 | $340,000 | 357 | 19 | 102.8% | 10.7% | 9.7% | -2.2% |
| 2019 | $351,798 | $341,000 | 349 | 32 | 100.3% | -0.3% | 0.3% | -2.2% |
| 2020 | $365,011 | $352,750 | 292 | 23 | 100.9% | 3.8% | 3.4% | -16.3% |
| 2021 | $428,548 | $400,000 | 426 | 17 | 104.1% | 17.4% | 13.4% | 45.9% |
| 2022 | $440,573 | $420,000 | 297 | 19 | 103.4% | 2.8% | 5.0% | -30.3% |
| 2023 | $445,358 | $428,000 | 238 | 27 | 101.3% | 1.1% | 1.9% | -19.9% |
| 2024 | $442,753 | $419,000 | 254 | 39 | 99.5% | -0.6% | -2.1% | 6.7% |
This page is copyrighted by http://rereport.com. All rights are reserved.