| Kensington | ||||||||
| (Single Family Homes) | ||||||||
| Prices | Other | % Change from Year Before | ||||||
| Average | Median | Sold | DOM | SP/LP | Average | Median | Sold | |
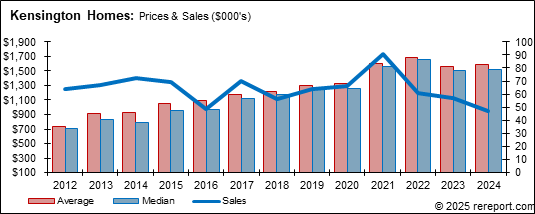
| 2012 | $737,572 | $702,038 | 64 | 30 | 103.4% | |||
| 2013 | $909,841 | $825,000 | 67 | 23 | 105.5% | 23.4% | 17.5% | 4.7% |
| 2014 | $926,295 | $794,500 | 72 | 25 | 108.8% | 1.8% | -3.7% | 7.5% |
| 2015 | $1,045,488 | $950,168 | 69 | 18 | 113.7% | 12.9% | 19.6% | -4.2% |
| 2016 | $1,087,806 | $975,000 | 49 | 19 | 114.6% | 4.0% | 2.6% | -29.0% |
| 2017 | $1,172,529 | $1,126,000 | 70 | 21 | 117.0% | 7.8% | 15.5% | 42.9% |
| 2018 | $1,213,039 | $1,172,500 | 56 | 23 | 112.4% | 3.5% | 4.1% | -20.0% |
| 2019 | $1,295,516 | $1,277,500 | 64 | 21 | 112.7% | 6.8% | 9.0% | 14.3% |
| 2020 | $1,322,223 | $1,253,500 | 66 | 18 | 112.6% | 2.1% | -1.9% | 3.1% |
| 2021 | $1,598,800 | $1,565,000 | 91 | 15 | 124.6% | 20.9% | 24.9% | 37.9% |
| 2022 | $1,685,234 | $1,650,000 | 61 | 17 | 124.5% | 5.4% | 5.4% | -33.0% |
| 2023 | $1,563,822 | $1,500,000 | 57 | 17 | 118.2% | -7.2% | -9.1% | -6.6% |
| 2024 | $1,581,404 | $1,525,000 | 47 | 19 | 113.8% | 1.1% | 1.7% | -17.5% |
This page is copyrighted by http://rereport.com. All rights are reserved.