
| Trends at a Glance | |||
| (Single-family Homes) | |||
| Nov 13 | Oct 13 | Nov 12 | |
| Median Price: | $633,488 | $601,668 | $462,104 |
| Average Price: | $499,500 | $478,608 | $345,000 |
| Home Sales: | 650 | 734 | 935 |
| DOM: | 28 | 29 | 35 |
| Sold Price/List Price Ratio | 100.8% | 101.3% | 101.1% |
California home sales and prices to rise in 2014 as market transitions toward primary home buyers.
The C.A.R. forecast sees sales gaining 3.2% next year. Sales in 2013 will be down 2.1% from 2012. (Detached home sales in Contra Costa County are down 27.6% through November.)
"The housing market has improved over the past year, and we expect this trend to continue into 2014," said C.A.R. President Don Faught. "As the economy enters the fourth year of a modest recovery, we expect to see a strong demand for homeownership, as buyers who have been competing with investors and facing an extreme shortage of housing return from the sidelines."
The average for 30-year fixed mortgage interest rates will rise to 5.3%.
The California median home price is forecast to increase 6% to $432,800 in 2014, following a projected 28% increase in 2013 to $408,600. (The median price for detached homes in Contra Costa County is up 29.4% through November.)
"We've seen a marked improvement in housing market conditions in a year with the distressed market shrinking from one in three sales a year ago to less than one in five in recent months, thanks primarily to sharp gains in home prices," said C.A.R. Vice President and Chief Economist Leslie Appleton-Young. "As the market continues to improve, more previously underwater homeowners will look toward selling, making housing inventory less scarce in 2014. As a result of these factors, we'll see home price increases moderate from the double-digit increases we saw for much of this year to mid-single digits in most of the state."
Sales of single-family, re-sale homes were down 30.5% year-over-year. Year-to-date, home sales are off 27.6%.
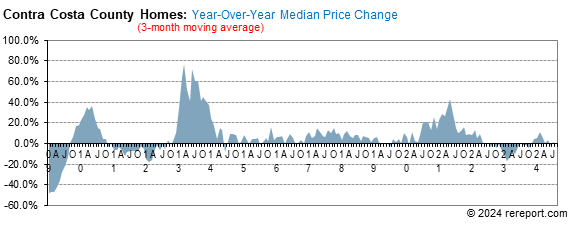
The median sales price was up an astounding 44.8% year-over-year. That's the twelfth month in a row the median price has been higher by double-digits.
The sale price to list price ratio stayed over 100% for the seventeenth month in a row: 100.8%. The ratio peaked in April at 103.7% and has been declining ever since, which indicates the market is cooling, ever so slightly.
| Contra Costa County Price Differences | |||||
| from January 2013 & Peak & Trough | |||||
| Homes: detached | |||||
| YTD | Peak % | Trough % | Peak | Trough | |
| 3-month | 41% | -29% | 91% | Jul-07 | Mar-09 |
| 12-month | 47% | -26% | 61% | Oct-07 | Sep-09 |
| Homes: attached | |||||
| 3-month | 45% | -25% | 114% | Jun-07 | Feb-12 |
| 12-month | 56% | -29% | 72% | Jul-06 | Feb-12 |
for single-family, re-sale homes in Contra Costa County plunged 5.1 points to -36.1. (See chart below)
rose 1.6 points to +34.2.
momentum by using a 12-month moving average to eliminate seasonality. By comparing this year's 12-month moving average to last year's, we get a percentage showing market momentum.
the blue area shows momentum for home sales while the red line shows momentum for pending sales of single-family, re-sale homes. The purple line shows momentum for the average price.
As you can see, pricing momentum has an inverse relationship to sales momentum.
The median sales price for re-sale condos has been gaining ground at a torrid pace. It has increased by double-digits for the past fifteen months. The median price jumped 40.9% last month compared to November 2012.
Condo sales were down 24.1%, year-over-year, with 173 condos sold.
As with homes, the sales price to list price ratio has been over 100% for the past seventeen months. It was 10105% last month. The recent peak happened in May at 105.7% and the ratio has declined every month since.
The average days on market bottomed out in July at 16. Last month it was 23. The average since January 2005 is 50.
Notices of default, the first step in the foreclosure process, in Contra Costa County, were down 50.8% in November from October. Year-over-year, notices were down 68.9%, according to PropertyRadar.com.
Notices of sale fell 11.9% from October. They were down 66.5% year-over-year.
After the filing of a Notice of Trustee Sale, there are only three possible outcomes. First, the sale can be cancelled for reasons that include a successful loan modification or short sale, a filing error, or a legal requirement to re-file the notice after extended postponements.
Alternatively, if the property is taken to sale, the bank will place the opening bid. If a third party, typically an investor, bids more than the bank's opening bid, the property will be sold to the third party; if not, it will go back to the bank and become part of that bank's REO inventory.
In November, cancellations were down 24.6% from October, and they were down 75.5% year-over-year.
Properties that went back to the bank fell 9.1% from October, and they were down 63.2% year-over-year.
The total number of properties that have had a notice of default filed rose by 48.2% from October. Year-over-year, notices were off 25.2%.
The total number of homes scheduled for sale decreased by 4.9% from October, and they were down 71.3% year-over-year.
The total number of homes owned by the banks dropped 1.9% from October, and they were down 37.1% year-over-year.
Banks own approximately 1,097 homes in Contra Costa County.
Remember, the real estate market is a matter of neighborhoods and houses. No two are the same. For complete information on a particular neighborhood or property, call me.
P.S. The FHA requires all condo projects to be re-certified before they will make a loan. To find out if the condo project you're interested in is eligible, go here: https://entp.hud.gov/idapp/html/condlook.cfm.


The real estate market is very hard to generalize. It is a market made up of many micro markets. For complete information on a particular neighborhood or property, call me.
If I can help you devise a strategy, call or click the buying or selling link in the menu to the left.
Complete monthly sales statistics for Contra Costa County are below. Monthly graphs are available for each city in the county.
| November Sales Statistics | |||||||||||
| (Single-family Homes) | |||||||||||
| Prices | Units | Change from last year | Change from last month | ||||||||
| Median | Average | Sold | DOM | SP/LP | Median | Average | Sold | Median | Average | Sold | |
| County | $499,500 | $633,488 | 650 | 28 | 100.8% | 44.8% | 37.1% | -30.5% | 4.4% | 5.3% | -11.4% |
| Alamo | $1,315,000 | $1,418,750 | 10 | 29 | 98.9% | 13.0% | 17.2% | -50.0% | 1.7% | 1.4% | -37.5% |
| Antioch | $308,500 | $306,340 | 66 | 26 | 102.3% | 35.3% | 32.6% | -44.5% | -2.1% | -0.8% | -14.3% |
| Bay Point | $316,000 | $268,900 | 5 | 47 | 104.9% | 124.4% | 51.8% | -64.3% | 70.4% | 18.7% | 25.0% |
| Blackhawk | $1,185,000 | $1,228,333 | 6 | 72 | 98.5% | 46.7% | 52.1% | 200.0% | 15.9% | 3.7% | -25.0% |
| Brentwood | $420,000 | $424,191 | 50 | 27 | 99.5% | 24.2% | 20.3% | -37.5% | -3.4% | -10.3% | 4.2% |
| Clayton | $593,750 | $666,575 | 8 | 36 | 98.9% | 11.0% | 21.5% | -42.9% | -8.7% | 6.1% | -52.9% |
| Concord | $441,500 | $477,546 | 66 | 29 | 99.9% | 29.9% | 37.3% | -45.0% | 7.7% | 9.1% | -16.5% |
| Danville | $1,080,000 | $1,181,407 | 53 | 27 | 100.2% | 35.0% | 21.2% | 0.0% | 11.3% | 15.7% | 51.4% |
| Discovery Bay | $459,500 | $461,822 | 18 | 33 | 97.7% | 41.4% | 26.3% | -14.3% | 4.9% | -6.7% | 5.9% |
| El Cerrito | $560,000 | $585,400 | 15 | 20 | 105.1% | 17.2% | 17.2% | -40.0% | -7.8% | -11.8% | -11.8% |
| El Sobrante | $400,000 | $391,700 | 5 | 30 | 102.9% | 53.8% | 28.7% | -54.5% | 3.0% | -4.2% | -50.0% |
| Hercules | $500,000 | $509,255 | 11 | 26 | 100.5% | 44.5% | 44.7% | -47.6% | 7.5% | 12.0% | -26.7% |
| Kensington | $842,500 | $814,969 | 6 | 30 | 106.6% | -0.4% | -0.4% | -14.3% | -31.2% | -31.2% | 0.0% |
| Lafayette | $1,056,000 | $1,373,265 | 17 | 44 | 99.7% | 8.3% | 23.7% | -37.0% | -0.4% | 2.1% | -22.7% |
| Martinez | $465,000 | $523,902 | 21 | 22 | 100.5% | 31.9% | 35.6% | -47.5% | 5.7% | 6.7% | -27.6% |
| Moraga | $1,117,000 | $1,044,889 | 9 | 27 | 100.8% | 22.7% | 4.6% | -30.8% | -6.9% | -8.7% | -18.2% |
| Oakley | $310,000 | $333,165 | 31 | 22 | 99.5% | 13.8% | 26.2% | -13.9% | -15.1% | -9.8% | 6.9% |
| Orinda | $1,052,000 | $1,102,023 | 18 | 25 | 99.5% | 2.8% | 2.0% | 28.6% | -4.7% | -12.8% | -10.0% |
| Pinole | $355,000 | $353,813 | 8 | 26 | 105.7% | 28.9% | 30.4% | -55.6% | -2.2% | -5.2% | -33.3% |
| Pittsburg | $300,000 | $301,506 | 29 | 38 | 101.8% | 42.9% | 39.4% | -34.1% | -8.4% | -12.4% | -37.0% |
| Pleasant Hill | $571,000 | $616,625 | 28 | 22 | 101.8% | 29.8% | 30.1% | 3.7% | -2.0% | 4.6% | -26.3% |
| Richmond | $323,000 | $323,147 | 40 | 26 | 105.2% | 55.3% | 44.1% | -48.1% | 8.6% | -2.8% | -33.3% |
| Rodeo | $323,250 | $306,417 | 6 | 17 | 101.7% | 37.6% | 29.7% | 0.0% | 10.5% | 13.4% | 0.0% |
| San Ramon | $835,000 | $908,130 | 64 | 24 | 101.1% | 9.8% | 16.5% | 18.5% | 3.2% | 5.5% | 39.1% |
| Walnut Creek | $780,000 | $844,487 | 39 | 27 | 102.6% | 4.9% | 9.8% | 2.6% | -1.3% | 2.8% | -20.4% |
| November Sales Statistics | |||||||||||
| (Condos/Townhomes) | |||||||||||
| Prices | Units | Change from last year | Change from last month | ||||||||
| Median | Average | Sold | DOM | SP/LP | Median | Average | Sold | Median | Average | Sold | |
| County | $310,000 | $343,691 | 173 | 23 | 100.5% | -5.6% | -6.6% | -14.4% | -5.6% | -6.6% | -14.4% |
| Antioch | $110,000 | $100,500 | 3 | 9 | 101.7% | -0.2% | -7.2% | -50.0% | -0.2% | -7.2% | -50.0% |
| Concord | $194,500 | $201,296 | 24 | 19 | 101.3% | 8.7% | 3.3% | 0.0% | 8.7% | 3.3% | 0.0% |
| Danville | $505,000 | $525,167 | 12 | 29 | 100.4% | -1.9% | 1.9% | -7.7% | -1.9% | 1.9% | -7.7% |
| Hercules | $223,000 | $216,000 | 4 | 11 | 100.6% | 4.7% | -0.5% | -33.3% | 4.7% | -0.5% | -33.3% |
| Martinez | $290,000 | $287,690 | 5 | 18 | 101.5% | -3.3% | -1.8% | -44.4% | -3.3% | -1.8% | -44.4% |
| Moraga | $538,500 | $499,500 | 6 | 36 | 99.0% | 43.6% | 11.0% | -25.0% | 43.6% | 11.0% | -25.0% |
| Pleasant Hill | $385,000 | $372,143 | 7 | 8 | 101.0% | -20.2% | -13.5% | 16.7% | -20.2% | -13.5% | 16.7% |
| Richmond | $231,000 | $224,283 | 6 | 38 | 104.8% | -15.8% | -24.4% | -14.3% | -15.8% | -24.4% | -14.3% |
| San Pablo | $173,000 | $191,875 | 4 | 62 | 105.0% | -34.7% | -27.6% | 300.0% | -34.7% | -27.6% | 300.0% |
| San Ramon | $469,900 | $495,629 | 21 | 26 | 99.7% | -13.8% | 0.7% | -32.3% | -13.8% | 0.7% | -32.3% |
| Walnut Creek | $310,500 | $349,231 | 70 | 21 | 100.5% | -14.3% | -9.3% | -2.8% | -14.3% | -9.3% | -2.8% |
This page is copyrighted by http://rereport.com. All rights are reserved.