
| Trends at a Glance | |||
| (Single-family Homes) | |||
| Jul 15 | Jun 15 | Jul 14 | |
| Average Price: | $733,034 | $740,036 | $733,845 |
| Median Price: | $575,000 | $560,000 | $569,000 |
| Home Sales: | 1,084 | 1,173 | 966 |
| DOM: | 24 | 26 | 25 |
| Sold Price/List Price Ratio | 101.9% | 102.3% | 101.6% |
Ever since the median price of single-family, re-sale homes went over $500,000 in March, it was been waffling between that and $575,000. If the median price pops over $600,000, all bets are off.
Sales of single-family, re-sale homes were up by double-digits, year-over-year, for the fifth month in a row. Home sales have been higher than the year before for the past eight months.
Inventory, the lack thereof, continues to drive the market. Although inventory increased in July, there are only 1,867 active listings on the market. That’s just a bit more than fifty days.
A balanced market is considered to have 180 days of inventory available.
Sales of single-family, re-sale homes were up 12.2% year-over-year. Compared to June, home sales were down 7.6%. Year-to-date, home sales are up 12.2%.
The median price for homes was up 2.7% from June, and it was up 1.1% year-over-year. The median price has been higher than the year before for 30 out of the past 32 months.
Average days on market last month was 24. The average for the past fourteen years is 44.
The sale price to list price ratio stayed over 100% for the sixth month in a row: 101.9%.
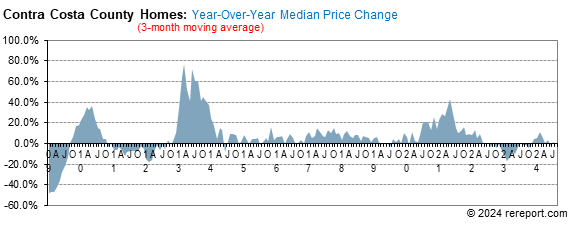
for single-family, re-sale homes in Contra Costa County gained 1.6 points to +7.0. (See chart below)
slipped 0.3 of a point to +4.1.
momentum by using a 12-month moving average to eliminate seasonality. By comparing this year's 12-month moving average to last year's, we get a percentage showing market momentum.
the blue area shows momentum for home sales while the red line shows momentum for pending sales of single-family, re-sale homes. The purple line shows momentum for the average price.
As you can see, pricing momentum has an inverse relationship to sales momentum.
The median sales price for re-sale condos jumped 11.4% year-over-year. It rose 13.9% from June.
Condo sales popped 27.4% year-over-year with 293 condos sold. Compared to June, condo sales were up 5.4%. Year-to-date, condo sales are up 27.4%.
The sales price to list price ratio stayed over 100% for the sixth month in a row: 102.3%.
Remember, the real estate market is a matter of neighborhoods and houses. No two are the same. For complete information on a particular neighborhood or property, call me.
P.S. The FHA requires all condo projects to be re-certified before they will make a loan. To find out if the condo project you're interested in is eligible, go here: https://entp.hud.gov/idapp/html/condlook.cfm.


The real estate market is very hard to generalize. It is a market made up of many micro markets. For complete information on a particular neighborhood or property, call me.
If I can help you devise a strategy, call or click the buying or selling link in the menu to the left.
Complete monthly sales statistics for Contra Costa County are below. Monthly graphs are available for each city in the county.
| July Sales Statistics | |||||||||||
| (Single-family Homes) | |||||||||||
| Prices | Units | Change from last year | Change from last month | ||||||||
| Median | Average | Sold | DOM | SP/LP | Median | Average | Sold | Median | Average | Sold | |
| County | $575,000 | $733,034 | 1,084 | 24 | 101.9% | 1.1% | -0.1% | 12.2% | 2.7% | -0.9% | -7.6% |
| Alamo | $1,480,000 | $1,687,828 | 15 | 42 | 98.7% | -9.6% | -3.0% | -57.1% | -6.3% | -2.3% | -57.1% |
| Antioch | $347,000 | $354,336 | 105 | 24 | 101.7% | 6.8% | 5.0% | 12.9% | 1.3% | 3.7% | -19.2% |
| Bay Point | $340,500 | $341,433 | 12 | 25 | 101.8% | 49.3% | 43.7% | 71.4% | 8.1% | 1.8% | -14.3% |
| Blackhawk | $1,450,000 | $1,742,955 | 11 | 48 | 98.0% | -19.5% | -3.2% | 1000.0% | -11.6% | 15.7% | 22.2% |
| Brentwood | $500,000 | $515,491 | 93 | 31 | 100.3% | 9.9% | 10.1% | 17.7% | -1.8% | -5.0% | -17.0% |
| Clayton | $718,500 | $740,375 | 10 | 17 | 101.6% | 9.0% | 5.9% | -41.2% | -4.2% | -3.1% | -33.3% |
| Concord | $521,500 | $550,991 | 105 | 20 | 102.1% | 5.7% | 11.3% | 25.0% | 6.5% | 3.8% | -4.5% |
| Danville | $1,180,000 | $1,346,234 | 84 | 21 | 101.1% | 4.5% | 4.7% | 10.5% | -0.6% | 5.4% | 10.5% |
| Discovery Bay | $465,000 | $541,423 | 13 | 74 | 98.6% | -15.8% | -12.8% | -40.9% | -19.1% | -11.7% | -72.3% |
| El Cerrito | $793,000 | $819,876 | 29 | 18 | 110.4% | 14.0% | 14.0% | -6.5% | 6.6% | 26.1% | 26.1% |
| El Sobrante | $487,500 | $501,014 | 14 | 19 | 107.5% | 3.7% | 8.1% | 55.6% | -7.3% | -7.6% | -12.5% |
| Hercules | $530,000 | $578,124 | 19 | 29 | 101.3% | 7.0% | 13.3% | -5.0% | 7.1% | 18.8% | 18.8% |
| Kensington | $950,000 | $968,400 | 5 | 16 | 115.2% | 10.9% | 10.9% | -44.4% | 11.6% | 11.6% | -16.7% |
| Lafayette | $1,332,500 | $1,421,758 | 32 | 27 | 101.5% | 11.0% | 10.3% | 3.2% | -8.1% | -9.6% | -41.8% |
| Martinez | $533,000 | $514,752 | 53 | 22 | 101.6% | 3.7% | -0.4% | 23.3% | -5.7% | -7.7% | 17.8% |
| Moraga | $1,300,000 | $1,270,181 | 16 | 15 | 102.2% | 15.0% | 5.6% | -30.4% | 5.7% | -8.4% | 33.3% |
| Oakley | $397,500 | $386,918 | 52 | 17 | 100.7% | 8.9% | 3.0% | 26.8% | 4.6% | -0.8% | -1.9% |
| Orinda | $1,485,500 | $1,605,034 | 26 | 38 | 101.7% | 8.0% | 7.9% | -33.3% | 5.9% | 1.8% | -18.8% |
| Pinole | $450,000 | $456,661 | 19 | 30 | 103.8% | 12.5% | 13.7% | 26.7% | -0.6% | -3.6% | -13.6% |
| Pittsburg | $364,300 | $392,205 | 67 | 22 | 102.1% | 12.1% | 9.8% | 59.5% | -2.1% | -2.7% | -2.9% |
| Pleasant Hill | $710,750 | $682,839 | 28 | 16 | 103.0% | 11.9% | 2.7% | 3.7% | 12.4% | 4.3% | -30.0% |
| Richmond | $404,500 | $442,088 | 74 | 25 | 107.5% | 15.6% | 13.5% | 27.6% | -12.1% | -5.3% | -5.1% |
| Rodeo | $440,000 | $402,857 | 7 | 24 | 100.7% | 5.8% | 1.0% | 40.0% | 29.4% | 15.2% | 133.3% |
| San Ramon | $1,015,000 | $1,045,962 | 91 | 15 | 101.8% | 9.7% | 5.6% | 21.3% | -5.4% | -5.4% | 23.0% |
| Walnut Creek | $885,673 | $957,673 | 75 | 24 | 101.4% | -1.4% | 5.5% | 27.1% | -1.5% | -0.4% | 41.5% |
| July Sales Statistics | |||||||||||
| (Condos/Townhomes) | |||||||||||
| Prices | Units | Change from last year | Change from last month | ||||||||
| Median | Average | Sold | DOM | SP/LP | Median | Average | Sold | Median | Average | Sold | |
| County | $410,000 | $444,093 | 293 | 21 | 102.3% | 7.0% | 1.8% | 5.4% | 7.0% | 1.8% | 5.4% |
| Antioch | $119,250 | $123,813 | 8 | 26 | 101.5% | -22.8% | -21.7% | -33.3% | -22.8% | -21.7% | -33.3% |
| Concord | $255,000 | $263,387 | 37 | 21 | 102.9% | 4.9% | 3.4% | 8.8% | 4.9% | 3.4% | 8.8% |
| Danville | $640,000 | $618,780 | 17 | 19 | 101.6% | -10.0% | -11.9% | -29.2% | -10.0% | -11.9% | -29.2% |
| Hercules | $286,000 | $291,250 | 7 | 30 | 102.6% | -2.6% | -2.2% | -30.0% | -2.6% | -2.2% | -30.0% |
| Martinez | $336,000 | $362,125 | 12 | 28 | 101.2% | 1.8% | 5.4% | -14.3% | 1.8% | 5.4% | -14.3% |
| Moraga | $690,000 | $600,667 | 9 | 10 | 105.5% | 86.5% | 28.3% | -10.0% | 86.5% | 28.3% | -10.0% |
| Pleasant Hill | $445,000 | $448,909 | 11 | 12 | 101.9% | 3.2% | 1.4% | -15.4% | 3.2% | 1.4% | -15.4% |
| Richmond | $315,000 | $314,955 | 11 | 20 | 105.5% | -24.6% | -23.5% | -21.4% | -24.6% | -23.5% | -21.4% |
| San Pablo | $252,500 | $290,707 | 6 | 20 | 102.1% | 44.3% | 41.0% | 20.0% | 44.3% | 41.0% | 20.0% |
| San Ramon | $645,000 | $592,640 | 35 | 17 | 102.5% | 16.7% | 0.5% | 2.9% | 16.7% | 0.5% | 2.9% |
| Walnut Creek | $455,000 | $498,258 | 115 | 21 | 102.8% | 8.3% | 3.8% | 35.3% | 8.3% | 3.8% | 35.3% |
Improving economy and job growth draw buyers back to housing market, forming more households, REALTOR® survey finds
With an improving economy and job market over the past year, home buyers have started forming households again, and buyers who previously experienced a foreclosure or short sale are back in the housing market, according to the CALIFORNIA ASSOCIATION OF REALTORS®’ (C.A.R.) “2015 Survey of California Home Buyers.”
In 2015, more households were formed as the share of buyers who previously lived with their parents increased to 12% – the highest in the survey’s history, up from 2% in 2014. Additionally, the share of those who previously rented dipped from 40% in 2014 to 39% in 2015, and those who previously owned fell from 59% in 2014 to 47% in 2015.
With distressed sales at record lows, California is returning to a more normal housing market, with those who previously went through a foreclosure or short sale returning to the market and purchasing homes again. More than one in five home buyers (22%) experienced a distressed sale, most of which occurred after 2007. A further indication of this return to normalcy is reflected in the share of buyers who were previously “underwater” on their homes, which increased to 23% in 2015, up from 4% in 2014.
Additional findings from C.A.R.’s “2015 Survey of California Home Buyers” include:
In what could further exacerbate a future housing inventory shortage, buyers in 2015 indicated they plan to keep their home longer than ever – an average of 20 years – substantially longer than the six years cited by home buyers in 2013.
Buyers cited “tired of renting” (15%), “wanted a place to live” (14%), “desired larger home” (12%), “changed jobs/relocated” (11%), and “desired better/other location” (8%) as the top reasons for purchasing a home. In looking specifically at first-time buyers, “tired of renting” was the top reason for purchasing a home (21%), followed by “wanted a place to live” (19%).
Despite the recent run up in home prices, the vast majority (85%) felt that their home was worth the price they paid, while 14% said the price was too high, and 1% said the price was too low.
• While the majority of buyers (75%) were satisfied with their home purchase, one-fourth made compromises, with 13% saying they selected the best house given the limited supply in their desired neighborhood, and 12% who said they selected the best house in an affordable neighborhood because prices were too high in their preferred neighborhood.
Buyers put an average of 24% down on their home purchase in 2015, down from 28% in 2014, and 25% in 2013, but more than what has been the traditional 20% since 2009.
The primary source of down payment for first-time buyers was personal savings, cited by 49% of first-time buyers, followed by “borrowed or gift,” cited by 33% of first-time buyers. The primary sources of down payment for repeat buyers were personal savings (34%) and proceeds from sale of previous residence (34%).
Buyers spent an average of 18 weeks considering buying a home before contacting a real estate agent in 2015, down from an average of 19 weeks in 2014 and a high of an average of 24 weeks in 2013. They spent an average of 14 weeks investigating homes and neighborhoods before contacting an agent in 2015, down from an average of 21 weeks in 2014 and a high of an average 29 weeks in 2013.
In 2015, it took home buyers an average of 12 weeks to look for a home, the longest since C.A.R. began the survey. It took an average of 10 weeks in 2014 and 2013 for home buyers to find a home. In a sign of less market competition, buyers made fewer offers in 2015 compared to previous years – an average of 2.6 offers, down from an average of 3.6 offers in 2014, and an average of 3 offers in 2013.
Your local REALTOR®, that’s me, can assist you with this. Call me.
This page is copyrighted by http://rereport.com. All rights are reserved.