
Statistical Tables | What's Involved in a Comparative Market Analysis | C.A.R.'s 2016 California Housing Market Forecast
| Trends at a Glance | |||
| (Single-family Homes) | |||
| Oct 15 | Sep 15 | Oct 14 | |
| Average Price: | $670,819 | $697,062 | $642,739 |
| Median Price: | $525,500 | $548,950 | $510,000 |
| Home Sales: | 882 | 926 | 876 |
| DOM: | 29 | 31 | 33 |
| Sold Price/List Price Ratio | 101.0% | 100.9% | 100.8% |
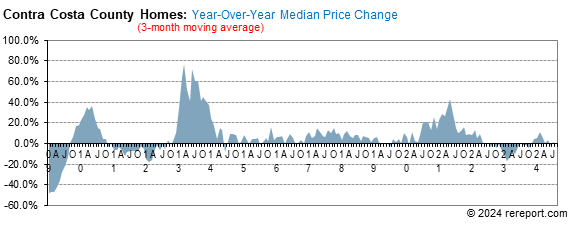
While the medain price of single-family, re-sale homes continues to rise, year-over-year, it has been lower than the month before for the past two months.
Sales of single-family, re-sale homes have been higher than the year before for the past eleven months. Year-to-date, home sales are up 12.3%. Nevertheless, home sales have been weaker than the month before for the past four months.
Sales of single-family, re-sale homes were up 0.7% year-over-year. Compared to September, home sales were down 4.8%.
The median price for homes was down 4.3% from September, but it was up 3.0% year-over-year.
Average days on market last month was 29. The average for the past fourteen years is 44.
The sale price to list price ratio stayed over 100% for the ninth month in a row: 101.0%.
for single-family, re-sale homes in Contra Costa County fell 0.5 of a point to +9.9. (See chart below)
was flat at +3.9.
momentum by using a 12-month moving average to eliminate seasonality. By comparing this year's 12-month moving average to last year's, we get a percentage showing market momentum.
the blue area shows momentum for home sales while the red line shows momentum for pending sales of single-family, re-sale homes. The purple line shows momentum for the average price.
As you can see, pricing momentum has an inverse relationship to sales momentum.
The median sales price for re-sale condos fell 4.4% year-over-year.
Condo sales were off 12.3% year-over-year with 207 condos sold. Compared to September, condo sales were down 8.0%. Year-to-date, condo sales are up 7.5%.
The sales price to list price ratio stayed over 100% for the ninth month in a row: 101.1%.
Remember, the real estate market is a matter of neighborhoods and houses. No two are the same. For complete information on a particular neighborhood or property, call me.
P.S. The FHA requires all condo projects to be re-certified before they will make a loan. To find out if the condo project you're interested in is eligible, go here: https://entp.hud.gov/idapp/html/condlook.cfm.


The real estate market is very hard to generalize. It is a market made up of many micro markets. For complete information on a particular neighborhood or property, call me.
If I can help you devise a strategy, call or click the buying or selling link in the menu to the left.
Complete monthly sales statistics for Contra Costa County are below. Monthly graphs are available for each city in the county.
| October Sales Statistics | |||||||||||
| (Single-family Homes) | |||||||||||
| Prices | Units | Change from last year | Change from last month | ||||||||
| Median | Average | Sold | DOM | SP/LP | Median | Average | Sold | Median | Average | Sold | |
| County | $525,500 | $670,819 | 882 | 29 | 101.0% | 3.0% | 4.4% | 0.7% | -4.3% | -3.8% | -4.8% |
| Alamo | $2,075,000 | $2,513,192 | 13 | 57 | 97.9% | 42.6% | 72.6% | 8.3% | 43.1% | 63.6% | -23.5% |
| Antioch | $350,000 | $352,250 | 102 | 29 | 100.2% | 4.5% | 4.6% | 3.0% | -1.5% | -0.9% | -10.5% |
| Bay Point | $315,000 | $344,809 | 11 | 30 | 101.2% | -3.2% | 10.3% | 10.0% | 7.0% | 9.0% | -31.3% |
| Blackhawk | $1,495,000 | $1,640,750 | 5 | 112 | 95.9% | 18.2% | 29.5% | 66.7% | -18.1% | -12.4% | 0.0% |
| Brentwood | $485,000 | $522,039 | 83 | 32 | 99.5% | 6.2% | 11.2% | 9.2% | -4.7% | -4.4% | 15.3% |
| Clayton | $720,000 | $708,000 | 5 | 29 | 100.1% | 17.1% | 11.1% | -50.0% | -4.4% | -1.8% | -37.5% |
| Concord | $523,250 | $531,469 | 100 | 29 | 101.2% | 14.4% | 6.8% | 6.4% | 2.6% | -1.4% | -6.5% |
| Danville | $1,112,000 | $1,236,276 | 48 | 33 | 99.6% | -0.3% | 2.7% | -9.4% | 4.1% | -0.4% | -18.6% |
| Discovery Bay | $495,000 | $568,181 | 21 | 30 | 99.6% | -2.0% | 0.7% | -4.5% | 3.1% | 5.7% | -22.2% |
| El Cerrito | $759,000 | $737,038 | 13 | 19 | 110.8% | 2.4% | 2.4% | -51.9% | 3.4% | -18.8% | -18.8% |
| El Sobrante | $492,000 | $487,321 | 14 | 23 | 103.0% | 8.1% | 2.4% | 27.3% | 19.3% | 5.8% | 133.3% |
| Hercules | $600,888 | $580,272 | 11 | 21 | 100.0% | 20.7% | 20.0% | 10.0% | 9.8% | 6.6% | -54.2% |
| Kensington | $915,000 | $952,167 | 6 | 17 | 114.7% | 18.9% | 18.9% | -53.8% | -21.0% | -21.0% | 20.0% |
| Lafayette | $1,284,500 | $1,407,300 | 20 | 21 | 101.5% | 8.9% | 4.2% | -33.3% | -3.1% | -3.6% | -25.9% |
| Martinez | $499,900 | $528,276 | 29 | 44 | 100.7% | 9.9% | 12.4% | 20.8% | -8.2% | -10.2% | -14.7% |
| Moraga | $1,260,000 | $1,235,111 | 9 | 13 | 102.0% | 17.5% | 13.3% | -25.0% | -0.8% | -7.6% | -55.0% |
| Oakley | $417,000 | $424,790 | 42 | 27 | 99.7% | 22.1% | 21.9% | 0.0% | 8.0% | 10.3% | -14.3% |
| Orinda | $1,260,000 | $1,276,227 | 22 | 22 | 103.5% | -6.7% | -13.1% | -4.3% | -3.1% | -9.9% | 10.0% |
| Pinole | $450,000 | $449,821 | 17 | 20 | 103.4% | 2.3% | 3.9% | 13.3% | 4.7% | -1.1% | 13.3% |
| Pittsburg | $350,000 | $372,220 | 61 | 37 | 99.8% | 14.8% | 17.8% | 74.3% | -6.0% | -6.7% | 7.0% |
| Pleasant Hill | $666,500 | $671,479 | 28 | 24 | 102.0% | 2.7% | -2.7% | -3.4% | 1.0% | 1.1% | -9.7% |
| Richmond | $450,500 | $470,604 | 66 | 26 | 106.5% | 37.8% | 23.2% | -13.2% | 0.1% | -6.8% | 32.0% |
| Rodeo | $380,000 | $393,455 | 11 | 23 | 99.9% | -7.3% | 7.7% | 83.3% | -16.5% | -13.5% | 1000.0% |
| San Ramon | $967,500 | $1,003,776 | 63 | 29 | 99.7% | 8.3% | 7.6% | -7.4% | 1.8% | -5.2% | -6.0% |
| Walnut Creek | $916,617 | $1,000,316 | 52 | 24 | 101.1% | 9.1% | 7.5% | 15.6% | 4.5% | 6.1% | 2.0% |
| October Sales Statistics | |||||||||||
| (Condos/Townhomes) | |||||||||||
| Prices | Units | Change from last year | Change from last month | ||||||||
| Median | Average | Sold | DOM | SP/LP | Median | Average | Sold | Median | Average | Sold | |
| County | $368,000 | $433,312 | 207 | 25 | 101.1% | -5.6% | -4.3% | -8.0% | -5.6% | -4.3% | -8.0% |
| Antioch | $170,000 | $181,800 | 5 | 31 | 103.6% | 0.0% | 18.2% | 25.0% | 0.0% | 18.2% | 25.0% |
| Concord | $250,000 | $267,075 | 39 | 22 | 101.9% | 5.5% | 8.0% | 62.5% | 5.5% | 8.0% | 62.5% |
| Danville | $741,000 | $708,783 | 12 | 21 | 100.0% | 19.2% | 14.0% | 0.0% | 19.2% | 14.0% | 0.0% |
| Hercules | $305,000 | $289,000 | 5 | 27 | 106.3% | -14.7% | -16.4% | -58.3% | -14.7% | -16.4% | -58.3% |
| Martinez | $330,000 | $340,885 | 13 | 24 | 100.1% | -7.0% | -7.7% | 18.2% | -7.0% | -7.7% | 18.2% |
| Moraga | $602,000 | $589,000 | 3 | 17 | 104.6% | -12.8% | -11.7% | -80.0% | -12.8% | -11.7% | -80.0% |
| Pleasant Hill | $366,250 | $404,050 | 10 | 41 | 100.7% | -20.2% | -11.7% | -37.5% | -20.2% | -11.7% | -37.5% |
| Richmond | $284,450 | $334,870 | 6 | 31 | 103.3% | -27.1% | -14.4% | -33.3% | -27.1% | -14.4% | -33.3% |
| San Pablo | $312,799 | $304,552 | 4 | 5 | 101.9% | 26.1% | -3.4% | 33.3% | 26.1% | -3.4% | 33.3% |
| San Ramon | $560,000 | $581,187 | 23 | 13 | 101.9% | 7.7% | 6.4% | -23.3% | 7.7% | 6.4% | -23.3% |
| Walnut Creek | $451,000 | $513,815 | 70 | 29 | 100.6% | 6.1% | 4.7% | -4.1% | 6.1% | 4.7% | -4.1% |
A comparative market analysis, or CMA, is a real estate agent's evaluation, based on local listing and sales data, to determine the probable sale price of a property in the current market. Sellers can use a CMA to help determine a list price. Buyers can use a CMA to help them decide what to offer on a listing they want to buy.
The accuracy of the analysis will depend in part on the quality of the data. The listings used for comparison should ideally be located in the neighborhood, and they should be as similar as possible to the subject property.
To get a complete picture of your local marketplace, the CMA should include information about currently available comparable listings, pending sales, sales that occurred within the last 6 months, as well as information about listings that did not sell during the listing period. These are called expired listings.
For sellers, the homes currently for sale are your competition. How you price your home relative to the competition is critical to the sale of your home. If possible, visit Sunday open houses to see how your home compares before you select a list price.
Pending sale listings in your neighborhood represent the most recent sales activity. Try to find out as much about these listings as possible. Beware of the neighborhood grapevine. A combination of wishful thinking and enthusiasm can result in a rumor that a listing sold for an inflated price. The actual sale price may be quite a bit lower.
Carefully analyze the information about homes that have sold. This sales data is the most reliable indicator of what the market will bear price-wise.
Typically, the sales should have occurred no longer than 6 months ago. However, in a market that is changing rapidly, six months may be too long a time frame. When home prices are moving up or down quickly, it's wise to shorten the time frame. Six-month-old listings may be out of date.
Estimating a probable sale price based on a CMA involves a certain amount of subjectivity. Accurately predicting a sale price is easiest in neighborhoods of tract housing where all houses are pretty much the same. It's more difficult in neighborhoods where there's a lot of variability in home size, style and condition.
An agent's knowledge of the local market can affect the accuracy of a CMA, particularly in a neighborhood with a lot of variability in the housing stock. Unless the agent has actually seen the comparable listings, he may not draw the correct conclusions.
Call me for an accurate Comparative Market Analysis.
California home sales to increase slightly, while prices post slowest gain in five years.
California's housing market will continue to improve into 2016, but a shortage of homes on the market and a crimp in housing affordability also will persist, according to the CALIFORNIA ASSOCIATION OF REALTORS®' (C.A.R.) "2016 California Housing Market Forecast".
The C.A.R. forecast sees an increase in existing home sales of 6.3 percent next year to reach 433,000 units, up from the projected 2015 sales figure of 407,500 homes sold. Sales in 2015 also will be up 6.3 percent from the 383,300 existing, single-family homes sold in 2014.
"Solid job growth and favorable interest rates will drive a strong demand for housing next year," said C.A.R. President Chris Kutzkey. "However, in regions where inventory is tight, such as the San Francisco Bay Area, sales growth could be limited by stiff market competition and diminishing housing affordability. On the other hand, demand in less expensive areas such as Solano County, the Central Valley, and Riverside/San Bernardino areas will remain strong thanks to solid job growth in warehousing, transportation, logistics, and manufacturing in these areas."
C.A.R.'s forecast projects growth in the U.S. Gross Domestic Product of 2.7 percent in 2016, after a projected gain of 2.4 percent in 2015. With nonfarm job growth of 2.3 percent in California, the state's unemployment rate should decrease to 5.5 percent in 2016 from 6.3 percent in 2015 and 7.5 percent in 2014.
The average for 30-year, fixed mortgage interest rates will rise only slightly to 4.5 percent but will still remain at historically low levels.
The California median home price is forecast to increase 3.2 percent to $491,300 in 2016, following a projected 6.5 percent increase in 2015 to $476,300. This is the slowest rate of price appreciation in five years.
"The foundation for California's housing market remains strong, with moderating home prices, signs of credit easing, and the state continuing to lead the nation in economic and job growth," said C.A.R. Vice President and Chief Economist Leslie Appleton-Young. "However, the global economic slowdown, financial market volatility, and the anticipation of higher interest rates are some of the challenges that may have an adverse impact on the market's momentum next year. Additionally, as we see more sales shift to inland regions of the state, the change in mix of sales will keep increases in the statewide median price tempered."
This page is copyrighted by http://rereport.com. All rights are reserved.