
Statistical Tables | Mortgage Rate Outlook | 2016 FHFA loan limits
| Trends at a Glance | |||
| (Single-family Homes) | |||
| Oct 16 | Sep 16 | Oct 15 | |
| Average Price: | $689,575 | $704,714 | $665,483 |
| Median Price: | $540,000 | $560,000 | $520,000 |
| Home Sales: | 875 | 908 | 933 |
| DOM: | 28 | 28 | 30 |
| SP/LP Ratio: | 101.0% | 100.5% | 101.0% |
| (Condos/Townhomes) | |||
| Oct 16 | Sep 16 | Oct 15 | |
| Average Price: | $483,735 | $470,360 | $435,026 |
| Median Price: | $460,000 | $420,000 | $375,000 |
| Home Sales: | 209 | 253 | 223 |
| DOM: | 24 | 28 | 26 |
| SP/LP Ratio: | 100.8% | 100.6% | 100.9% |
Home sales expected to edge up slightly in 2017, while prices post slowest gain in six years
Following a dip in home sales in 2016, California’s housing market will post a nominal increase in 2017, as supply shortages and affordability constraints hamper market activity, according to the "2017 California Housing Market Forecast," released today by the CALIFORNIA ASSOCIATION OF REALTORS ®’ (C.A.R.) .
The C.A.R. forecast sees a modest increase in existing home sales of 1.4 percent next year to reach 413,000 units, up slightly from the projected 2016 sales figure of 407,300 homes sold. Sales in 2016 also will be virtually flat at 407,300 existing, single-family home sales, compared with the 408,800 pace of homes sold in 2015.
"Next year, California’s housing market will be driven by tight housing supplies and the lowest housing affordability in six years," said C.A.R. President Pat "Ziggy" Zicarelli. "The market will experience regional differences, with more affordable areas, such as the Inland Empire and Central Valley, outperforming the urban coastal centers, where high home prices and a limited availability of homes on the market will hamper sales. As a result, the Southern California and Central Valley regions will see moderate sales increases, while the San Francisco Bay Area will experience a decline as home buyers migrate to peripheral cities with more affordable options."
C.A.R.’s forecast projects growth in the U.S. Gross Domestic Product of 2.2 percent in 2017, after a projected gain of 1.5 percent in 2016. With California’s nonfarm job growth at 1.6 percent, down from a projected 2.3 percent in 2016, the state’s unemployment rate will reach 5.3 percent in 2017, compared with 5.5 percent in 2016 and 6.2 percent in 2015.
The average for 30-year, fixed mortgage interest rates will rise only slightly to 4.0 percent in 2017, up from 3.6 percent in 2016, but will still remain at historically low levels.
The California median home price is forecast to increase 4.3 percent to $525,600 in 2017, following a projected 6.2 percent increase in 2016 to $503,900, representing the slowest rate of price appreciation in six years.
"With the California economy continuing to outperform the nation, the demand for housing will remain robust even with supply and affordability constraints still very much in evidence. The net result will be California’s housing market posting a modest increase in 2017," said C.A.R. Vice President and Chief Economist Leslie Appleton-Young. "The underlying fundamentals continue to support overall home sales growth, but headwinds, such as global economic uncertainty and deteriorating housing affordability, will temper stronger sales activity."
The median price for homes rose 3.8%, year-over-year.
Home sales were down 6.2% year-over-year. They were off 3.6% compared to September.
Average days on market last month was 28. The average for the past fourteen years is 41.
for homes fell 0.8 of a point to –6.2.
for single-family homes gained 0.6 of a point to +6.4.
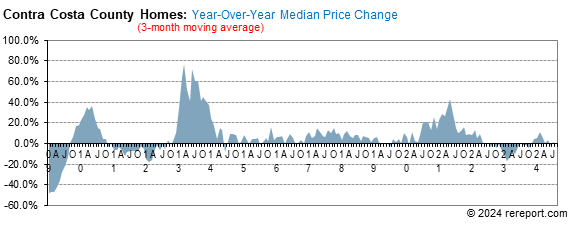
Our momentum statistics are based on 12-month moving averages to eliminate monthly and seasonal variations.
momentum by using a 12-month moving average to eliminate seasonality. By comparing this year's 12-month moving average to last year's, we get a percentage showing market momentum.
the blue area shows momentum for home sales while the red line shows momentum for pending sales of single-family, re-sale homes. The purple line shows momentum for the average price.
As you can see, pricing momentum has an inverse relationship to sales momentum.
The median price for condos rose 11.2%, year-over-year. The median price has been higher than the year before fifty-six months in a row.
Condo sales were up 6.3% year-over-year. They were down 17.4% compared to September.
The sale price to list price ratio stayed over 100% for the fifty-second month in a row: 100.8%.
Average days on market last month was 24. The average for the past fourteen years is 43.
Remember, the real estate market is a matter of neighborhoods and houses. No two are the same. For complete information on a particular neighborhood or property, call me.
P.S. The FHA requires all condo projects to be re-certified before they will make a loan. To find out if the condo project you're interested in is eligible, go here: https://entp.hud.gov/idapp/html/condlook.cfm.


The real estate market is very hard to generalize. It is a market made up of many micro markets. For complete information on a particular neighborhood or property, call me.
If I can help you devise a strategy, call or click the buying or selling link in the menu to the left.
Complete monthly sales statistics for Contra Costa County are below. Monthly graphs are available for each city in the county.
| October Sales Statistics | |||||||||||
| (Single-family Homes) | |||||||||||
| Prices | Units | Change from last year | Change from last month | ||||||||
| Median | Average | Sold | DOM | SP/LP | Median | Average | Sold | Median | Average | Sold | |
| County | $540,000 | $689,575 | 875 | 28 | 101.0% | 3.8% | 3.6% | -6.2% | -3.6% | -2.1% | -3.6% |
| Alamo | $1,520,000 | $1,576,582 | 11 | 37 | 101.4% | -21.1% | -35.5% | -21.4% | -2.3% | -9.0% | -15.4% |
| Antioch | $388,000 | $383,774 | 121 | 23 | 101.0% | 10.9% | 9.6% | 3.4% | 5.9% | 1.9% | 4.3% |
| Bay Point | $295,000 | $325,545 | 11 | 17 | 100.2% | -6.3% | -5.6% | 0.0% | -23.4% | -12.0% | -26.7% |
| Blackhawk | $1,715,000 | $1,825,727 | 11 | 38 | 97.8% | 5.9% | 20.4% | 10.0% | 22.3% | 30.8% | 83.3% |
| Brentwood | $498,000 | $536,012 | 60 | 33 | 99.7% | 2.2% | 2.5% | -30.2% | -11.1% | -6.6% | -34.8% |
| Clayton | $723,500 | $723,550 | 10 | 31 | 100.0% | 1.5% | 4.2% | 66.7% | 13.8% | 6.2% | 0.0% |
| Concord | $537,000 | $559,643 | 94 | 24 | 100.7% | 2.6% | 5.5% | -9.6% | -3.2% | -4.5% | -7.8% |
| Danville | $1,170,000 | $1,187,462 | 46 | 35 | 98.6% | 2.9% | -5.4% | -8.0% | -3.2% | -7.1% | -20.7% |
| Discovery Bay | $525,000 | $652,000 | 23 | 83 | 98.0% | 6.1% | 15.3% | 4.5% | -2.2% | 11.9% | 4.5% |
| El Cerrito | $847,500 | $866,450 | 20 | 15 | 113.0% | 17.6% | 17.6% | 53.8% | 17.0% | 42.9% | 42.9% |
| El Sobrante | $525,000 | $536,727 | 11 | 39 | 103.4% | 12.3% | 11.8% | -31.3% | 1.4% | 4.7% | -8.3% |
| Hercules | $601,125 | $585,664 | 19 | 25 | 100.5% | -0.7% | 0.2% | 58.3% | 11.3% | 4.9% | 72.7% |
| Kensington | $1,062,000 | $1,286,400 | 5 | 13 | 112.4% | 35.1% | 35.1% | -16.7% | 11.9% | 11.9% | 66.7% |
| Lafayette | $1,325,000 | $1,504,895 | 19 | 32 | 102.6% | 3.2% | 6.9% | -5.0% | -2.9% | -1.6% | -20.8% |
| Martinez | $540,000 | $536,605 | 39 | 23 | 99.6% | 8.0% | 1.6% | 34.5% | -0.6% | -5.3% | 2.6% |
| Moraga | $1,162,500 | $1,184,167 | 6 | 13 | 102.0% | -7.7% | -4.1% | -33.3% | -9.9% | -5.4% | 0.0% |
| Oakley | $422,000 | $449,089 | 47 | 26 | 100.7% | 3.9% | 6.5% | 6.8% | 0.8% | 3.3% | 6.8% |
| Orinda | $1,326,500 | $1,548,634 | 22 | 14 | 100.6% | 4.4% | 20.0% | -4.3% | -4.6% | 3.1% | 29.4% |
| Pinole | $536,000 | $561,115 | 13 | 39 | 102.1% | 19.1% | 24.7% | -23.5% | 6.1% | 10.0% | -13.3% |
| Pittsburg | $419,000 | $436,088 | 58 | 28 | 100.2% | 20.6% | 17.2% | -9.4% | 1.0% | 4.5% | 23.4% |
| Pleasant Hill | $700,000 | $760,017 | 26 | 24 | 101.3% | 5.0% | 13.2% | -7.1% | -0.1% | 5.0% | -7.1% |
| Richmond | $456,500 | $468,277 | 66 | 26 | 104.6% | 6.2% | 1.1% | -7.0% | 1.1% | 1.2% | 6.5% |
| Rodeo | $485,000 | $482,000 | 7 | 39 | 99.4% | 27.6% | 22.5% | -36.4% | 21.3% | 16.9% | 16.7% |
| San Ramon | $1,071,700 | $1,104,420 | 69 | 32 | 99.5% | 9.9% | 7.1% | 4.5% | 9.6% | 5.4% | 4.5% |
| Walnut Creek | $997,000 | $1,038,558 | 43 | 20 | 100.7% | 9.3% | 4.1% | -18.9% | -2.7% | -4.5% | -21.8% |
| October Sales Statistics | |||||||||||
| (Condos/Townhomes) | |||||||||||
| Prices | Units | Change from last year | Change from last month | ||||||||
| Median | Average | Sold | DOM | SP/LP | Median | Average | Sold | Median | Average | Sold | |
| County | $460,000 | $483,735 | 209 | 24 | 100.8% | 9.5% | 2.8% | -17.4% | 9.5% | 2.8% | -17.4% |
| Antioch | $158,000 | $188,000 | 4 | 30 | 101.9% | -19.4% | -0.3% | -60.0% | -19.4% | -0.3% | -60.0% |
| Concord | $299,500 | $304,606 | 18 | 15 | 102.0% | 19.8% | 11.1% | -48.6% | 19.8% | 11.1% | -48.6% |
| Danville | $680,000 | $684,827 | 15 | 32 | 99.1% | -10.2% | -11.3% | 0.0% | -10.2% | -11.3% | 0.0% |
| Hercules | $335,000 | $352,992 | 13 | 23 | 99.6% | -12.4% | -4.6% | 62.5% | -12.4% | -4.6% | 62.5% |
| Martinez | $432,000 | $405,955 | 11 | 35 | 100.8% | 2.9% | -1.9% | 10.0% | 2.9% | -1.9% | 10.0% |
| Moraga | $572,500 | $566,417 | 6 | 30 | 101.0% | -17.9% | -10.4% | -25.0% | -17.9% | -10.4% | -25.0% |
| Pleasant Hill | $512,500 | $512,750 | 8 | 35 | 100.1% | 2.9% | 1.9% | -11.1% | 2.9% | 1.9% | -11.1% |
| Richmond | $430,000 | $448,786 | 14 | 26 | 100.5% | 14.2% | 7.2% | -22.2% | 14.2% | 7.2% | -22.2% |
| San Pablo | $280,000 | $278,400 | 5 | 19 | 103.3% | 33.6% | 32.8% | 150.0% | 33.6% | 32.8% | 150.0% |
| San Ramon | $553,750 | $592,419 | 28 | 23 | 99.9% | -9.2% | -1.1% | 21.7% | -9.2% | -1.1% | 21.7% |
| Walnut Creek | $495,000 | $517,187 | 72 | 21 | 101.1% | 5.3% | 1.6% | -25.0% | 5.3% | 1.6% | -25.0% |
Waiting For The "Some"
Nov 4, 2016 -- How much more positive economic data will it take for the Fed to make a change and lift short-term interest rates? According to the statement that accompanied the close of this week's meeting of the Federal Reserve Open Market Committee, it will wait until it sees "some further evidence of continued progress toward its objectives."
Of course, "some" is a rather vague amount, unquantifiable, and certainly leaves the Fed plenty of wiggle room to leave interest rates unchanged if economic growth or inflation trends don't continue along their present path. The Fed obviously couldn't bring itself to use a more specific term about the potential near-term direction of monetary policy, as they did last October, when they plainly said they would assess "whether it will be appropriate to raise the target range at its next meeting". The use of "some" as it pertains to further evidence doesn't commit to any time frame or specific goal, so it still remains unclear whether or not a change will actually come.
Last October's statement almost explicitly told the market to prepare for an imminent rate increase; this statement remains non-committal. In fact, one fewer vote to raise rates immediately was tallied this week when compared with September's outcome, so it might even be that the Fed is somewhat more undecided now than then. Currently, futures markets put about 72 percent chance of a change to the federal funds rate in December.
We'll now have a six-week period evaluating whether or not each key piece of economic data is strong enough to be considered "some further evidence", never knowing if even a somewhat weaker item is still good enough.
To sum it all up (pun intended), we have only "some" clarity as to the Fed's thinking about making a move. To be sure, a small move by the Fed (when or if it comes) won't have any great effect on long-term mortgage rates, so there's nothing to fear for potential homeowners or those still looking for their best opportunity to refinance.
By all indications, the little rise in mortgage rates noted by Freddie Mac this week seems to have petered out (last week we called for a 6-8 basis point increase; Freddie reported 7bps. Nailed it.) Next week features a lighter slate of economic data, and it looks as though rates underpinning mortgages have softened a bit. We think that the 30-year FRM as reported by Freddie Mac will show a 2-3 basis point decline by the time the next MarketTrends is written.
California REALTORS® disappointed FHFA did not increase Fannie Mae and Freddie Mac conforming loan limits
LOS ANGELES (Nov. 25) – The CALIFORNIA ASSOCIATION OF REALTORS® (C.A.R.) today issued the following statement in response to the Federal Housing Finance Agency's (FHFA) announcement to keep the 2016 maximum conforming loan limits for mortgages acquired by Fannie Mae and Freddie Mac at $417,000 on one-unit properties and a cap of $625,500 in high-cost areas. Loan limits were increased in Monterey, Napa, San Diego, and Sonoma counties:
“C.A.R. is disappointed that the FHFA didn't raise the Fannie Mae and Freddie Mac conforming loan limits for next year,” said C.A.R. President Ziggy Zicarelli. “Home prices in California have risen sharply over the past four years, yet conforming loan limits haven't changed during that time. Not increasing the loan limits will hurt California's housing market, further exacerbating housing affordability and preventing tens of thousands of California homebuyers from a chance at homeownership.”
C.A.R. and the NATIONAL ASSOCIATION OF REALTORS® (NAR) both have long advocated for making higher conforming loan limits permanent. As a result of C.A.R.'s and NAR's efforts, cities with high median home prices have benefited from a loan limit above the national conforming loan limit.
The conforming loan limit determines the maximum size of a mortgage that government-sponsored enterprises (GSEs) Fannie Mae and Freddie Mac can buy or “guarantee.” Non-conforming or “jumbo loans” typically have tighter underwriting standards and carry higher mortgage interest rates than conforming loans, increasing monthly payments and hampering the ability of families in California to purchase homes by making them less affordable.
This page is copyrighted by http://rereport.com. All rights are reserved.