
Statistical Tables | | Deed vs. Title: What's the Difference?
| Trends at a Glance | |||
| (Single-family Homes) | |||
| Feb 18 | Jan 18 | Feb 17 | |
| Average Price: | $771,221 | $692,622 | $690,338 |
| Median Price: | $610,000 | $555,000 | $550,000 |
| Home Sales: | 566 | 570 | 533 |
| DOM: | 31 | 32 | 35 |
| SP/LP Ratio: | 101.5% | 101.2% | 100.9% |
| (Condos/Townhomes) | |||
| Feb 18 | Jan 18 | Feb 17 | |
| Average Price: | $527,265 | $457,034 | $473,991 |
| Median Price: | $462,000 | $420,000 | $405,000 |
| Home Sales: | 166 | 147 | 189 |
| DOM: | 23 | 31 | 28 |
| SP/LP Ratio: | 103.4% | 101.1% | 100.3% |
The median price for single-family, re-sale homes in Contra Costa County gained 10.9%, year-over-year. The average price rose 11.7%.
The median price for condominiums was up 14.1% year-over-year. The average price was up 11.2% over last February.
Home sales were up 6.2% compared to last February.
Condo sales were down 12.2% year-over-year.
Multiple offers continue to be the norm. The sales price to list price ratio, or what buyers are paying over what sellers are asking remains at triple digits for homes: 101.5%.The ratio for condos was 103.4%.
Properties are moving fast. Days on market, or how long it takes to go from being listed to being under contract, were thirty-one days for homes and twenty-three for condos. The averages for the past fourteen years are forty and forty-one, respectively.
for homes jumped 6.4 points to +12.1.
for single-family homes gained 0.7 of a point to +10.4.
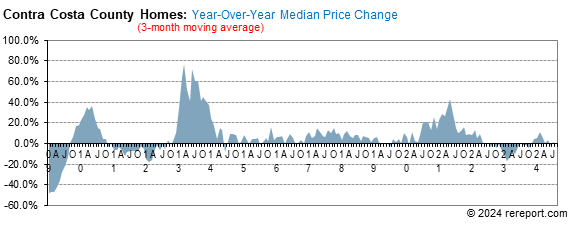
Our momentum statistics are based on 12-month moving averages to eliminate monthly and seasonal variations.
momentum by using a 12-month moving average to eliminate seasonality. By comparing this year's 12-month moving average to last year's, we get a percentage showing market momentum.
the blue area shows momentum for home sales while the red line shows momentum for pending sales of single-family, re-sale homes. The purple line shows momentum for the average price.
As you can see, pricing momentum has an inverse relationship to sales momentum.
Remember, the real estate market is a matter of neighborhoods and houses. No two are the same. For complete information on a particular neighborhood or property, call me.
P.S. The FHA requires all condo projects to be re-certified before they will make a loan. To find out if the condo project you're interested in is eligible, go here: https://entp.hud.gov/idapp/html/condlook.cfm.


The real estate market is very hard to generalize. It is a market made up of many micro markets. For complete information on a particular neighborhood or property, call me.
If I can help you devise a strategy, call or click the buying or selling link in the menu to the left.
Complete monthly sales statistics for Contra Costa County are below. Monthly graphs are available for each city in the county.
| February Sales Statistics | |||||||||||
| (Single-family Homes) | |||||||||||
| Prices | Units | Change from last year | Change from last month | ||||||||
| Median | Average | Sold | DOM | SP/LP | Median | Average | Sold | Median | Average | Sold | |
| County | $610,000 | $771,221 | 566 | 31 | 101.5% | 10.9% | 11.7% | 6.2% | 9.9% | 11.3% | -0.7% |
| Alamo | $1,850,000 | $1,988,600 | 5 | 49 | 100.4% | 4.2% | 17.4% | -44.4% | 12.1% | 22.5% | -61.5% |
| Antioch | $446,500 | $440,513 | 70 | 22 | 100.6% | 9.6% | 11.0% | 34.6% | 6.3% | 4.8% | 4.5% |
| Bay Point | $315,000 | $342,800 | 5 | 40 | 99.3% | -12.5% | 0.2% | -54.5% | -23.2% | -20.7% | -70.6% |
| Blackhawk | $1,715,000 | $1,825,727 | 11 | 38 | 97.8% | 5.9% | 20.4% | 10.0% | 22.3% | 30.8% | 83.3% |
| Brentwood | $632,500 | $636,940 | 48 | 34 | 100.0% | 20.5% | 9.3% | -7.7% | 6.3% | 4.1% | -32.4% |
| Clayton | $840,000 | $845,000 | 6 | 29 | 100.6% | 6.7% | 7.6% | -40.0% | 22.6% | 11.8% | 20.0% |
| Concord | $610,000 | $627,213 | 54 | 27 | 102.9% | 5.2% | 6.1% | -25.0% | -0.5% | -3.0% | -8.5% |
| Danville | $1,380,000 | $1,482,899 | 37 | 36 | 99.5% | 7.4% | 7.5% | 5.7% | 9.5% | 12.2% | 2.8% |
| Discovery Bay | $535,000 | $539,563 | 16 | 69 | 99.1% | 0.3% | -3.2% | -27.3% | -9.7% | -16.5% | 14.3% |
| El Cerrito | $910,000 | $957,714 | 7 | 13 | 121.8% | 1.2% | 1.2% | -22.2% | 16.0% | 133.3% | 133.3% |
| El Sobrante | $690,000 | $625,714 | 7 | 67 | 99.9% | 47.3% | 32.8% | -12.5% | 17.9% | 8.9% | -22.2% |
| Hercules | $630,000 | $665,695 | 10 | 49 | 101.2% | 11.0% | 21.8% | 66.7% | 10.0% | 9.4% | -9.1% |
| Kensington | $1,180,000 | $1,191,875 | 6 | 18 | 122.5% | -14.4% | -14.4% | 60.0% | -31.1% | -31.1% | 100.0% |
| Lafayette | $1,300,000 | $1,549,333 | 9 | 21 | 101.5% | -2.5% | -9.0% | 12.5% | 8.6% | 33.9% | 125.0% |
| Martinez | $667,500 | $725,694 | 28 | 35 | 100.4% | 7.7% | 3.5% | 12.0% | 7.7% | 11.4% | 12.0% |
| Moraga | $1,700,000 | $1,524,600 | 5 | 18 | 104.1% | 32.6% | -5.2% | -16.7% | 33.0% | 7.4% | -44.4% |
| Oakley | $452,500 | $461,169 | 42 | 40 | 100.5% | 4.0% | 4.1% | 35.5% | -4.2% | -2.3% | -4.5% |
| Orinda | $1,491,435 | $2,045,478 | 6 | 58 | 93.4% | 41.2% | 48.2% | 100.0% | 25.4% | 74.6% | 0.0% |
| Pinole | $611,950 | $597,650 | 6 | 20 | 102.8% | 30.2% | 26.4% | 20.0% | -5.9% | -6.1% | 0.0% |
| Pittsburg | $495,000 | $500,381 | 47 | 25 | 100.7% | 18.7% | 9.3% | 30.6% | 15.1% | 15.0% | 4.4% |
| Pleasant Hill | $817,500 | $817,354 | 14 | 15 | 104.3% | 3.6% | 6.5% | -6.7% | -12.6% | -9.5% | 27.3% |
| Richmond | $550,000 | $552,216 | 43 | 27 | 108.7% | 37.5% | 31.3% | -8.5% | 14.2% | 4.2% | -12.2% |
| Rodeo | $433,013 | $433,013 | 2 | 33 | 101.9% | 3.1% | 4.9% | -60.0% | -4.2% | -8.7% | -81.8% |
| San Ramon | $1,171,541 | $1,157,717 | 30 | 14 | 101.8% | 10.2% | 1.4% | 25.0% | -0.7% | -5.8% | 42.9% |
| Walnut Creek | $1,090,000 | $1,153,045 | 41 | 18 | 102.6% | 7.7% | 6.0% | 105.0% | 1.9% | 1.0% | 95.2% |
| February Sales Statistics | |||||||||||
| (Condos/Townhomes) | |||||||||||
| Prices | Units | Change from last year | Change from last month | ||||||||
| Median | Average | Sold | DOM | SP/LP | Median | Average | Sold | Median | Average | Sold | |
| County | $462,000 | $527,265 | 166 | 23 | 103.4% | 10.0% | 15.4% | -12.2% | 10.0% | 15.4% | 12.9% |
| Antioch | $263,500 | $284,250 | 4 | 19 | 104.4% | 7.6% | 18.5% | -33.3% | 7.6% | 18.5% | -55.6% |
| Concord | $327,500 | $326,285 | 20 | 13 | 106.5% | 5.6% | 7.5% | -13.0% | 5.6% | 7.5% | -25.9% |
| Danville | $855,000 | $836,857 | 9 | 14 | 101.6% | 18.8% | 14.5% | -25.0% | 18.8% | 14.5% | 50.0% |
| Hercules | $405,000 | $381,500 | 7 | 25 | 102.3% | 9.5% | 3.7% | -46.2% | 9.5% | 3.7% | 40.0% |
| Martinez | $427,000 | $447,250 | 4 | 8 | 101.1% | -1.6% | 7.7% | 33.3% | -1.6% | 7.7% | -60.0% |
| Moraga | $715,000 | $683,333 | 3 | 14 | 101.5% | 4.8% | 0.1% | -25.0% | 4.8% | 0.1% | 200.0% |
| Pleasant Hill | $568,750 | $562,979 | 12 | 28 | 102.1% | -4.4% | -2.3% | 140.0% | -4.4% | -2.3% | 71.4% |
| Richmond | $477,000 | $465,838 | 12 | 19 | 100.2% | 12.2% | 3.5% | -25.0% | 12.2% | 3.5% | -20.0% |
| San Pablo | $438,000 | $438,800 | 5 | 10 | 106.5% | 18.9% | 19.1% | 25.0% | 18.9% | 19.1% | 150.0% |
| San Ramon | $614,000 | $609,267 | 15 | 10 | 104.6% | -10.9% | -9.8% | -25.0% | -10.9% | -9.8% | 87.5% |
| Walnut Creek | $496,750 | $537,308 | 60 | 32 | 102.9% | 8.0% | 1.8% | -1.6% | 8.0% | 1.8% | 22.4% |
By: Audrey Ference
Deed vs. title: What's the difference? Most people
use the terms interchangeably, but there's a significant difference between the
two— a distinction that's important to understand when you're ready to purchase
a home. So let's look at what distinguishes deed from title.
Deed vs. title: The difference between these 2 real estate terms
"A deed is a legal document used to confirm or convey the ownership rights to a property," explains Anne Rizzo of Title Source Title Clearance. "It must be a physical document signed by both the buyer and the seller."
Title, however, is the legal way of saying you have ownership of the property. The title is not a document, but a concept that says you have the rights to use that property.
So when you buy a property, you will receive the deed, a document that proves you own it. That deed is an official document that says you have title to the real estate.
How to get the deed and take title of a property
To get the deed and "take title," or legally own the property, your lender will perform a title search. This ensures that the seller has the legal right to transfer ownership of the property to you, and that there are no liens against it. If everything is clear, then at closing the seller will transfer the title to you, and you become the legal possessor of the property.
The title or escrow company will then ensure the deed is recorded with the county assessor's office or courthouse, depending on where you live. You'll generally get a notification a few weeks after closing that your deed has been recorded. If you don't, check with the professional who did your closing and ensure that the paperwork has been filed. At that point, you have the deed and title to the real estate and the property is all yours.
What is title insurance?
Even with all of the due diligence a title company does before closing, there are rare instances when title problems can pop up later (e.g., missed liens and other legal issues that can be very costly to resolve). To protect against any financial loss, two types of title insurance exist: owner's title insurance and lender's title insurance.
"Unlike other types of insurance that protect the policyholder from events that may happen in the future, an owner’s title policy protects the buyer from events that have happened in the past," says Rizzo. "That may jeopardize their financial interest, such as title defects from fraud or paperwork errors, unpaid liens against the property, or claims that someone else is the real, legal property owner."
On the other hand, when you secure a mortgage, your lender or bank will require that you purchase lender's title insurance to protect the lender's investment in case any title problems arise. Lender's title insurance essentially protects the lender's interest in your property, which is typically until your mortgage is paid off.
This page is copyrighted by http://rereport.com. All rights are reserved.