
Statistical Tables | It's All About Labor
| Trends at a Glance | |||
| (Single-family Homes) | |||
| Aug 25 | Jul 25 | Aug 24 | |
| Average Price: | $1,134,856 | $1,141,345 | $1,170,632 |
| Median Price: | $845,000 | $855,000 | $835,000 |
| Home Sales: | 653 | 671 | 701 |
| DOM: | 33 | 30 | 28 |
| SP/LP Ratio: | 99.8% | 100.5% | 101.4% |
| (Condos/Townhomes) | |||
| Aug 25 | Jul 25 | Aug 24 | |
| Average Price: | $720,608 | $671,266 | $673,764 |
| Median Price: | $649,000 | $565,000 | $610,000 |
| Condo Sales: | 168 | 179 | 211 |
| DOM: | 35 | 39 | 41 |
| SP/LP Ratio: | 99.5% | 99.5% | 99.9% |
The median sales price for single-family, re-sale homes was up 1.2%
year-over-year. It was down 1.2% from July.
The average sales price of single-family, re-sale homes fell 3.1%
year-over-year. It was down 0.6% from July.
Sales of single-family, re-sale homes were down 6.8% year-over-year. There were
653 homes sold last month. The average monthly sales since 2005 is 907.
The sales price to list price ratio for homes fell to 99.8% from 100.5%.
Days on market, or how long it takes to go from being listed to being under
contract, was thirty-three days.
The median sales price for condos was up 14.9% from July, and it was up 6.4%
year-over-year. The average sales price was up 7% year-over-year.
Condo sales were down 6.1% from July, and they were down 20.4% year-over-year.
There were 168 condo sales last month.
The sales price to list price ratio for condos stayed at 99.5%.
Days on market, or how long it takes to go from being listed to being under
contract, was thirty-five days for condos.
Sales momentum…
for single-family homes fell 1.1 points to +0.
Pricing momentum…
for single-family homes rose 0.1 of a point to +0.2.
Our momentum statistics are based on 12-month moving averages to eliminate
monthly and seasonal variations.
This is an extraordinarily tough market for buyers. It's important to be calm
and realistic. If you don't know what to do or where to begin, give me a call
and let's discuss your situation and your options.
If you’re looking to sell, call me for a comprehensive Comparative Market
Analysis.
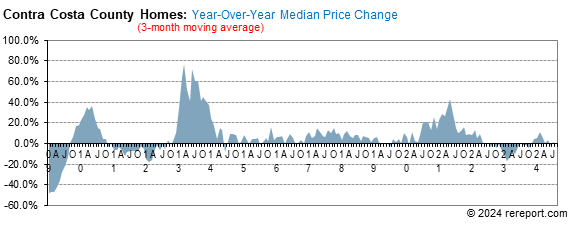
Our momentum statistics are based on 12-month moving averages to eliminate monthly and seasonal variations.
momentum by using a 12-month moving average to eliminate seasonality. By comparing this year's 12-month moving average to last year's, we get a percentage showing market momentum.
the blue area shows momentum for home sales while the red line shows momentum for pending sales of single-family, re-sale homes. The purple line shows momentum for the average price.
As you can see, pricing momentum has an inverse relationship to sales momentum.
Remember, the real estate market is a matter of neighborhoods and houses. No two are the same. For complete information on a particular neighborhood or property, call me.
P.S. The FHA requires all condo projects to be re-certified before they will make a loan. To find out if the condo project you're interested in is eligible, go here: https://entp.hud.gov/idapp/html/condlook.cfm.


The real estate market is very hard to generalize. It is a market made up of many micro markets. For complete information on a particular neighborhood or property, call me.
If I can help you devise a strategy, call or click the buying or selling link in the menu to the left.
Complete monthly sales statistics for Contra Costa County are below. Monthly graphs are available for each city in the county.
| August Sales Statistics | |||||||||||
| (Single-family Homes) | |||||||||||
| Prices | Units | Change from last year | Change from last month | ||||||||
| Median | Average | Sold | DOM | SP/LP | Median | Average | Sold | Median | Average | Sold | |
| County | $845,000 | $1,134,856 | 653 | 33 | 99.8% | 1.2% | -3.1% | -6.8% | -1.2% | -0.6% | -2.7% |
| Alamo | $2,425,000 | $2,538,184 | 19 | 26 | 99.3% | 1.0% | -10.2% | 72.7% | -23.0% | -12.8% | 46.2% |
| Antioch | $612,500 | $607,233 | 76 | 35 | 100.7% | -4.3% | -4.8% | -24.8% | 6.5% | 3.9% | 22.6% |
| Bay Point | $555,000 | $538,500 | 8 | 25 | 98.9% | -12.6% | -16.4% | 33.3% | 3.1% | 1.4% | -33.3% |
| Blackhawk | $2,225,000 | $2,225,000 | 1 | 7 | 111.3% | 53.4% | 27.7% | -90.9% | 29.7% | 21.9% | -90.9% |
| Brentwood | $765,000 | $845,585 | 45 | 47 | 97.8% | -7.3% | -3.9% | -28.6% | -5.8% | 2.4% | -27.4% |
| Clayton | $1,100,000 | $1,081,000 | 9 | 44 | 97.4% | -2.2% | -8.6% | 12.5% | -13.6% | -16.4% | 12.5% |
| Concord | $845,000 | $900,140 | 56 | 28 | 100.7% | 1.8% | -0.2% | -5.1% | 4.0% | 4.4% | -17.6% |
| Danville | $2,100,000 | $2,302,539 | 39 | 21 | 98.6% | -1.1% | -12.7% | -15.2% | -2.4% | 5.8% | 8.3% |
| Discovery Bay | $775,000 | $884,504 | 17 | 65 | 99.2% | -9.9% | -0.3% | -10.5% | -11.9% | 0.3% | -10.5% |
| El Cerrito | $1,405,000 | $1,329,631 | 9 | 23 | 119.0% | 13.7% | 13.7% | -47.1% | -8.5% | -55.0% | -55.0% |
| El Sobrante | $697,450 | $750,650 | 16 | 31 | 103.4% | -7.0% | -10.2% | 77.8% | 0.4% | -0.6% | 166.7% |
| Hercules | $815,000 | $859,800 | 5 | 40 | 100.7% | -10.4% | -5.1% | -54.5% | 5.8% | 7.5% | -66.7% |
| Kensington | $1,475,000 | $1,475,000 | 2 | 23 | 115.2% | -13.5% | -13.5% | 100.0% | -5.8% | -5.8% | -33.3% |
| Lafayette | $1,800,000 | $1,948,967 | 27 | 35 | 100.3% | 5.8% | -14.1% | 28.6% | -17.7% | -20.2% | 22.7% |
| Martinez | $823,500 | $986,011 | 28 | 24 | 99.0% | 9.4% | 24.4% | -6.7% | 11.7% | 28.2% | -22.2% |
| Moraga | $1,622,500 | $1,620,333 | 6 | 47 | 99.3% | -9.6% | -19.7% | -60.0% | -3.1% | -13.9% | -57.1% |
| Oakley | $640,000 | $661,972 | 49 | 39 | 100.8% | -11.7% | -6.8% | 75.0% | -12.4% | -13.8% | 63.3% |
| Orinda | $1,550,000 | $1,882,343 | 17 | 41 | 99.9% | -11.4% | -0.7% | -32.0% | -14.2% | -4.1% | -22.7% |
| Pinole | $670,000 | $749,000 | 10 | 37 | 99.1% | -13.0% | -4.5% | -23.1% | -5.6% | 8.1% | 11.1% |
| Pittsburg | $599,000 | $624,286 | 29 | 29 | 100.0% | 2.4% | 6.1% | 3.6% | 1.5% | 3.0% | 7.4% |
| Pleasant Hill | $1,052,500 | $1,087,655 | 20 | 35 | 98.6% | -0.7% | -7.1% | -4.8% | -7.7% | -1.8% | -20.0% |
| Richmond | $667,500 | $708,663 | 48 | 37 | 103.0% | 4.1% | 10.3% | -7.7% | 2.7% | 3.6% | -7.7% |
| Rodeo | $695,000 | $695,000 | 2 | 10 | 103.1% | 1.5% | 9.0% | -50.0% | 37.6% | 32.1% | -50.0% |
| San Ramon | $1,750,700 | $1,801,234 | 41 | 18 | 98.8% | -0.8% | -2.7% | -6.8% | 0.9% | -1.5% | 7.9% |
| Walnut Creek | $1,575,000 | $1,625,810 | 50 | 30 | 98.0% | 1.8% | -6.7% | 25.0% | 4.3% | 4.0% | 19.0% |
| August Sales Statistics | |||||||||||
| (Condos/Townhomes) | |||||||||||
| Prices | Units | Change from last year | Change from last month | ||||||||
| Median | Average | Sold | DOM | SP/LP | Median | Average | Sold | Median | Average | Sold | |
| County | $649,000 | $720,608 | 168 | 35 | 99.5% | 6.4% | 7.0% | -20.4% | 14.9% | 7.4% | -6.1% |
| Antioch | $317,500 | $318,000 | 4 | 22 | 103.0% | -15.3% | -14.7% | -50.0% | -13.0% | -4.9% | -33.3% |
| Concord | $404,950 | $450,611 | 22 | 40 | 99.1% | -7.8% | 1.5% | -24.1% | 0.7% | 9.3% | -35.3% |
| Danville | $990,000 | $1,085,067 | 15 | 20 | 99.6% | -18.1% | -3.7% | 7.1% | -15.7% | -3.9% | 36.4% |
| Hercules | $560,000 | $567,000 | 5 | 22 | 100.5% | -2.8% | 2.5% | -37.5% | 0.0% | 0.3% | -37.5% |
| Martinez | $650,000 | $639,543 | 9 | 34 | 100.6% | 28.2% | 17.3% | 0.0% | 4.0% | 12.2% | 80.0% |
| Moraga | $950,000 | $999,000 | 5 | 47 | 101.1% | -8.9% | 4.0% | -37.5% | 17.5% | 24.8% | -50.0% |
| Pleasant Hill | $617,000 | $594,889 | 9 | 19 | 99.1% | -13.4% | -17.5% | 125.0% | 12.4% | 8.4% | 800.0% |
| Richmond | $480,000 | $535,364 | 11 | 25 | 99.9% | -4.0% | -4.6% | 0.0% | 9.0% | 12.5% | -8.3% |
| San Pablo | $488,000 | $394,333 | 3 | 42 | 94.5% | -0.1% | -22.0% | -25.0% | 8.0% | -17.2% | -50.0% |
| San Ramon | $964,000 | $940,985 | 20 | 45 | 97.7% | 16.1% | 2.3% | 5.3% | 14.4% | 3.1% | 17.6% |
| Walnut Creek | $742,000 | $779,033 | 50 | 35 | 99.9% | 19.9% | 15.9% | -35.1% | 2.3% | -7.1% | 6.4% |
August 29, 2025 --
Home sales will soon be closing a soggy summer, but we'll have to wait another
month to see how August turned out. We already know that existing home sales
have been muted, and this week we learned that sales of new homes in July were
also pretty modest. Although June's sales figure was revised higher to a 656,000
annual rate, it doesn't much change the picture of a lumbering market for new
homes; for July, sales of new homes edged 0.6% lower, slipping to a 652,000
annual pace. While the supply of new homes available to buy did decline a little
bit, easing by 3,000 to a 499,000 annualized level, the 9.2 months of supply at
the present rate of sale is more than ample. New home prices continue to be very
competitive with existing stock; July's $403,800 was 0.8% below June's median
sales price, and is 5.9% below the median cost of a new home last July. By
contrast, the median price of an existing home sold in July was $422,400.
Existing home prices may be poised to have somewhat larger and more widespread
seasonal price declines this year, something we detail and discuss in the
analysis portion of our quarterly Home
Affordability Study.
Whether that will be enough to help bring more buyers into the market isn't
certain; lower mortgage rates will be required to help that occur. At least in
July, there were fewer buyers of existing home in the market, as the Pending
Home Sales Index from the National Association of Realtors found a 0.4% decrease
in the number of signed contracts to purchase homes. The PHSI leads closed sales
numbers by about two months, and based upon the last two months of declines, it
is hard to expect to see much improvement in existing home sales to close the
summer.
But there are of course at least some sales happening. The Mortgage Bankers
Association reported a 0.5% overall decrease in requests for mortgages in the
week ending August 22, but that decline all came from the refinancing side of
the market, with calls for funds to refinance existing loans dropping by 3.5%.
Applications for purchase-money mortgages ticked 2.2% higher for the week, and
in fact have managed to post a positive figure in each of the last four weeks.
Slightly lower mortgage rates during that time have helped support homebuyers to
at least a modest degree.
As much as we'd like to see lower interest rates and especially lower mortgage
rates, we'd rather not see the kind of increasing economic misery that makes
them necessary. As we've remarked before, if you don't have a job, it really
doesn't matter how low mortgage rates are, since you can't qualify for one to
buy a home or refinance, regardless of how attractive the rate may be.
A long weekend with the Labor Day holiday leaves mortgage rates poised to do
little. That's not uncommon to start September; it's typically the first full
week of the month (8th-12th this year) when things begin to move more quickly,
and we'd expect to see more action then, especially this year. For the next week
at least, we think that the average offered rate for a conforming 30-year fixed
rate mortgage as reported by Freddie Mac may wobble a little, managing to be
unchanged or perhaps posting as much as a two basis point decline. We'll see
what comes next Thursday.
This page is copyrighted by https://rereport.com. All rights are reserved.