| Trends at a Glance | |||
| (Single-family Homes) | |||
| Dec 12 | Nov 12 | Dec 11 | |
| Median Price: | $468,000 | $467,000 | $320,000 |
| Average Price: | $546,204 | $527,818 | $443,724 |
| Home Sales: | 841 | 953 | 914 |
| Sale/List Price Ratio: | 102.0% | 102.3% | 98.3% |
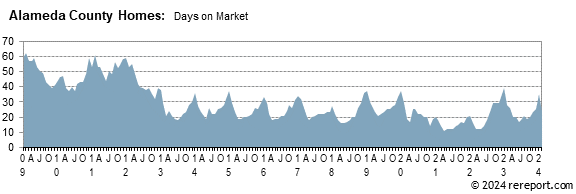
| Days on Market: | 39 | 32 | 58 |
Both single-family, re-sales homes and condo sales were strong in 2012. Home sales were up 17% from 2011. Condo sales rose for the fourth year in a row, gaining 23.7% over 2011.
To read the rest of the annual report, and California Association of REALTORS® 2013 Forecast, click here.
Sales of single-family, re-sale homes ended the year down 8% year-over-year.
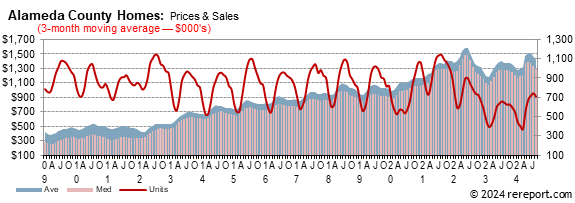
The median price for homes was up 46.3% year-over-year. The median price is now up 40% since January, based on a 3-month moving average!
The sales price to list price ratio stayed over 100% for the eighth month in a row: 102%.
| Alameda County Price Differences | |||||
| from January & Peak & Trough | |||||
| Homes: detached | |||||
| YTD | Peak % | Trough % | Peak | Trough | |
| 3-month | 40% | -32% | 82% | Jul-07 | Mar-09 |
| 12-month | 28% | -34% | 45% | Oct-07 | Sep-09 |
| Homes: attached | |||||
| 3-month | 43% | -36% | 52% | Jun-07 | Feb-12 |
| 12-month | 28% | -44% | 28% | Jan-06 | Feb-12 |
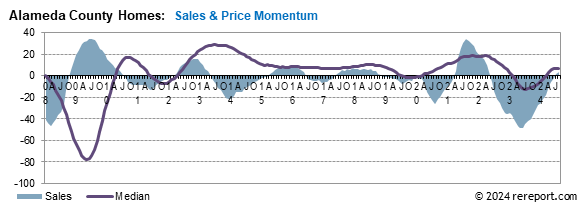
for single-family, re-sale homes in Alameda County slipped 0.4 of a point to +15.34. (See chart below)
for single-family, re-sale homes rose 2.7 points to +22.6.
sales momentum by using a 12-month moving average to eliminate seasonality. By comparing this year's 12-month moving average to last year's, we get a percentage showing market momentum.
the blue area shows momentum for home sales while the red line shows momentum for pending sales of single-family, re-sale homes. The purple line shows momentum for the median price.
The median price for condos was up 41.2% year-over-year. The median price is now up 43% since January, based on a 3-month moving average.
Condo sales were down 21.1% year-over-year.
The sales price to list price ratio stayed over 100% for the eighth month in a row: 102.5%.
In December, notices of default, the first step in the foreclosure process, fell 13.7% from November. Year-over-year, notices were down 51.4%, according to ForeclosureRadar.com.
Notices of sale, which set the date and time of an auction, and serve as the homeowner's final notice before sale, were down 65.5% year-over-year. Month-over-month, notices of sale dropped 24.4%.
After filing a Notice of Trustee Sale, there are only three possible outcomes. First, the sale can be cancelled for reasons that include a successful loan modification or short sale, a filing error, or a legal requirement to re-file the notice after extended postponements, such as bankruptcy.
Alternatively, if the property is taken to sale, the bank places the opening bid. If a third party, typically an investor, bids more than the bank's opening bid, the property will be sold to the third party; if not, it will go back to the bank.
Year-over-year, cancellations were up 14.8%. Compared to November, cancellations were down 8.5%.
Property that went back to banks dropped 8.7% from November, and were down 71.1% year-over-year.
The total number of properties that have had a notice of default filed decreased by 38.4% year-over-year.
The total number of properties scheduled for sale decreased by 41.8% year-over-year.
The number of properties owned by the banks dropped 44% year-over-year. The banks own about 1,985 properties in Alameda County.
For further details and a city-by-city breakdown of foreclosure statistics, go to https://foreclosureradar.com.

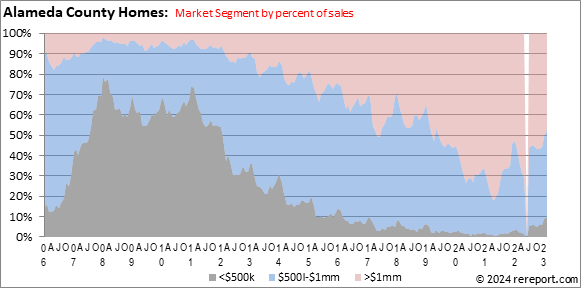
The local market has split into three parts: the lower-end, under about $500,000, where multiple offers are common; the mid-range, between $500,000 and $1MM where the market is more balanced; and the upper end, over $1MM.


The real estate market is very hard to generalize. It is a market made up of many micro markets. For complete information on a particular neighborhood or property, call me.
If I can help you devise a strategy, call or click the buying or selling link in the menu to the left.
Complete monthly sales statistics for the Alameda County are below. Monthly graphs are available for each city in the county.
| December Sales Statistics | |||||||||||
| (Single-family Homes) | |||||||||||
| Prices | Unit | Change from last year | Change from last month | ||||||||
| Area | Median | Average | Sales | DOM | SP/LP | Median | Average | Sales | Median | Average | Sales |
| County | $468,000 | $546,204 | 841 | 39 | 102.0% | 46.3% | 23.1% | -8.0% | 0.2% | 3.5% | -11.8% |
| Alameda | $632,500 | $651,545 | 22 | 72 | 103.9% | 19.3% | 19.7% | -21.4% | 20.5% | 23.5% | -53.2% |
| Albany | $682,000 | $642,714 | 7 | 14 | 116.3% | 49.9% | 38.8% | -30.0% | 7.2% | -8.2% | 16.7% |
| Berkeley | $752,500 | $795,318 | 48 | 32 | 101.9% | 18.5% | 20.1% | 2.1% | 6.6% | -4.7% | 2.1% |
| Castro Valley | $500,000 | $513,058 | 48 | 44 | 99.7% | 2.8% | 4.6% | 37.1% | -1.6% | -1.7% | 11.6% |
| Dublin | $588,500 | $632,824 | 40 | 37 | 101.6% | 4.2% | 12.0% | 37.9% | 3.8% | 3.8% | 14.3% |
| Fremont | $553,250 | $662,651 | 92 | 37 | 101.0% | 19.1% | 25.0% | -6.1% | -5.4% | -1.5% | -24.6% |
| Hayward | $331,000 | $340,357 | 77 | 50 | 103.2% | 22.6% | -32.5% | -30.6% | 4.1% | -1.9% | -18.9% |
| Livermore | $495,000 | $592,688 | 77 | 30 | 101.3% | 21.9% | 25.5% | 13.2% | 10.4% | 12.9% | -19.8% |
| Newark | $385,000 | $417,550 | 19 | 33 | 101.7% | 2.1% | 7.0% | -17.4% | -13.1% | -6.7% | 0.0% |
| Oakland | $367,500 | $448,402 | 230 | 39 | 104.3% | 36.9% | 22.7% | 6.5% | 5.8% | 2.6% | -9.4% |
| Piedmont | $1,468,056 | $1,448,519 | 6 | 30 | 109.9% | 23.6% | 8.6% | -25.0% | 27.1% | -1.5% | -33.3% |
| Pleasanton | $826,575 | $1,019,503 | 48 | 29 | 95.5% | 24.3% | 28.4% | -15.8% | 15.0% | 28.1% | -11.1% |
| San Leandro | $350,000 | $360,838 | 70 | 44 | 104.6% | 31.1% | 26.3% | 7.7% | 2.9% | -0.4% | 2.9% |
| San Lorenzo | $311,500 | $322,028 | 18 | 36 | 103.7% | 24.6% | 25.6% | 5.9% | -3.6% | -0.4% | 5.9% |
| Union City | $492,500 | $523,322 | 36 | 34 | 102.7% | 24.5% | 19.6% | -10.0% | 2.8% | 9.6% | -10.0% |
| December Sales Statistics | |||||||||||
| (Condos/Town Homes) | |||||||||||
| Prices | Unit | Change from last year | Change from last month | ||||||||
| Median | Average | Sales | DOM | SP/LP | Median | Average | Sales | Median | Average | Sales | |
| County | $276,750 | $307,574 | 232 | 33 | 102.5% | 41.2% | 27.3% | -21.1% | -4.3% | -6.7% | -10.1% |
| Alameda | $330,000 | $320,944 | 9 | 37 | 103.6% | 10.2% | 5.3% | -43.8% | -15.9% | -14.3% | -30.8% |
| Albany | $0 | $0 | 0 | 0 | 0.0% | n/a | n/a | n/a | n/a | n/a | n/a |
| Berkeley | $400,000 | $447,497 | 13 | 53 | 101.5% | 17.8% | 17.5% | 225.0% | 22.4% | 23.0% | 85.7% |
| Castro Valley | $370,000 | $353,000 | 3 | 14 | 105.6% | 74.1% | 43.9% | -25.0% | -1.5% | -1.3% | -62.5% |
| Dublin | $340,000 | $342,788 | 25 | 46 | 101.9% | 8.6% | 2.3% | -16.7% | -10.5% | -15.0% | 8.7% |
| Emeryville | $212,500 | $216,263 | 8 | 42 | 102.4% | -11.5% | -15.5% | -46.7% | -32.4% | -29.6% | 14.3% |
| Fremont | $320,000 | $379,246 | 45 | 23 | 102.1% | 39.1% | 42.4% | -11.8% | 0.4% | -2.4% | 15.4% |
| Hayward | $168,000 | $190,697 | 30 | 25 | 104.2% | -0.6% | 10.4% | 25.0% | -4.8% | -15.2% | 11.1% |
| Livermore | $325,000 | $309,031 | 13 | 34 | 102.7% | 30.5% | 32.6% | -38.1% | 9.2% | 0.0% | 8.3% |
| Newark | $235,000 | $249,414 | 7 | 8 | 104.8% | 23.7% | 23.9% | 133.3% | -4.5% | -11.3% | -36.4% |
| Oakland | $268,750 | $301,623 | 42 | 41 | 100.1% | 45.3% | 45.2% | 7.7% | -9.3% | -8.9% | -35.4% |
| Pleasanton | $355,000 | $356,527 | 13 | 45 | 103.9% | 53.5% | 42.6% | -35.0% | 0.6% | 1.4% | -31.6% |
| San Leandro | $215,000 | $221,170 | 9 | 15 | 106.9% | 65.4% | 35.9% | -47.1% | 21.1% | 26.5% | 80.0% |
| Union City | $217,500 | $234,536 | 14 | 33 | 106.0% | 26.5% | 24.8% | 16.7% | -10.7% | -19.7% | -22.2% |
This page is copyrighted by https://rereport.com. All rights are reserved.