Statistical Tables | Mortgage Rate Outlook | 10 Essential Questions To Ask When Buying A Home
| Trends at a Glance | |||
| (Single-family Homes) | |||
| Apr 17 | Mar 17 | Apr 16 | |
| Median Price: | $875,000 | $831,250 | $800,000 |
| Average Price: | $973,091 | $923,456 | $922,388 |
| Home Sales: | 766 | 764 | 800 |
| SP/LP Ratio: | 107.7% | 106.8% | 107.7% |
| Days on Market: | 19 | 24 | 18 |
| (Condos/Townhomes) | |||
| Apr 17 | Mar 17 | Apr 16 | |
| Median Price: | $586,000 | $575,000 | $530,000 |
| Average Price: | $610,364 | $594,163 | $550,533 |
| Home Sales: | 275 | 267 | 284 |
| SP/LP Ratio: | 105.4% | 104.4% | 105.8% |
| Days on Market: | 17 | 16 | 15 |
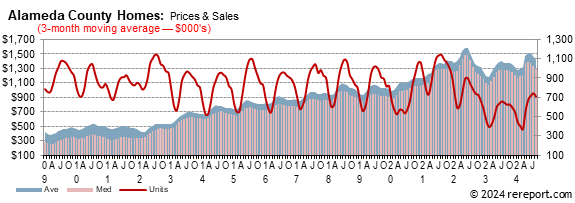
Prices for both single-family and condominium re-sale properties set new highs last month.
This shouldn’t be surprising as the cost of housing in Silicon Valley and San Francisco is pushing people to move further away in search of “affordable” housing.
The sales price to list price ratio for both homes and condos has been over 100% each month since April 2012.
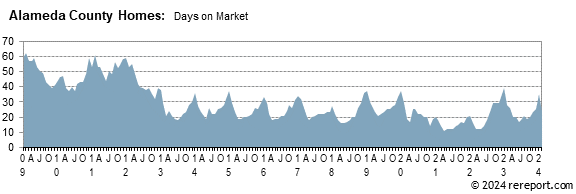
Properties are being quickly. Average Days on Market, which calculates the time from when a property first goes on the market to when it enters escrow, effectively taking it off the market, has entered the teens: nineteen days for single-family homes and seventeen days for condominiums.
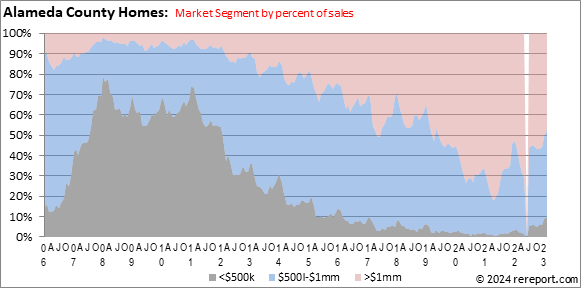
We’re also seeing a squeeze in the lower-end of the market. In 2012, the under $500K segment of the market constituted about 70% of all sales. This year it has slipped to less than 10%.
Below are
links to some real estate articles we thought might be useful, or at least
informative for you.
This white paper from the NAR’s includes tips for both buyers and sellers.
https://tinyurl.com/j6t65qs
Tax simplicity + liability protection
Single-member limited liability companies (SMLLCs) are limited liability
companies (LLCs) with only one member (owner). As with a corporation, operating
a business or investment activity as an LLC generally protects your personal
assets from exposure to liabilities related to the activity — under applicable
state law. However, SMLLCs offer some unique tax attributes that make them ideal
real estate ownership vehicles. Here’s the story on their advantages.
https://tinyurl.com/kt5bkdt
Saving money on your mortgage payments
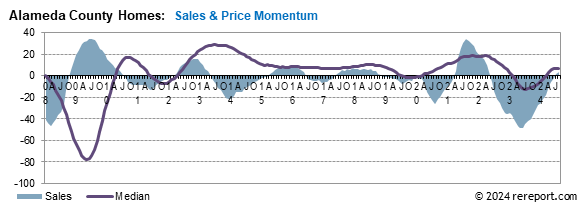
for homes rose 0.7 of a point to –4.4.
for single-family homes gained 0.3 of a point to +7.1.
sales momentum by using a 12-month moving average to eliminate seasonality. By comparing this year's 12-month moving average to last year's, we get a percentage showing market momentum.
the blue area shows momentum for home sales while the red line shows momentum for pending sales of single-family, re-sale homes. The purple line shows momentum for the median price.
This is an extraordinarily tough market for buyers. It's important to be calm and realistic. If you don't know what to do or where to begin, give me a call and let's discuss your situation and your options.


The real estate market is very hard to generalize. It is a market made up of many micro markets. For complete information on a particular neighborhood or property, call me.
If I can help you devise a strategy, call or click the buying or selling link in the menu to the left.
Complete monthly sales statistics for the Alameda County are below. Monthly graphs are available for each city in the county.
| April Sales Statistics | |||||||||||
| (Single-family Homes) | |||||||||||
| Prices | Unit | Change from last year | Change from last month | ||||||||
| Area | Median | Average | Sales | DOM | SP/LP | Median | Average | Sales | Median | Average | Sales |
| County | $875,000 | $973,091 | 766 | 19 | 107.7% | 9.4% | 5.5% | -4.3% | 5.3% | 5.4% | 0.3% |
| Alameda | $1,112,500 | $1,157,275 | 25 | 16 | 108.1% | 20.9% | 13.5% | -7.4% | 19.2% | 18.1% | 4.2% |
| Albany | $1,117,500 | $1,136,729 | 8 | 14 | 106.5% | 26.3% | 25.8% | 100.0% | -8.2% | -15.8% | 33.3% |
| Berkeley | $1,185,000 | $1,272,775 | 45 | 19 | 113.9% | -2.1% | -6.8% | -2.2% | 7.7% | 5.3% | 15.4% |
| Castro Valley | $825,000 | $841,400 | 37 | 16 | 102.9% | 6.0% | 9.0% | -11.9% | 6.6% | 7.2% | 2.8% |
| Dublin | $1,030,500 | $1,038,328 | 40 | 13 | 100.7% | 17.1% | 6.2% | 2.6% | -0.6% | 4.3% | 11.1% |
| Fremont | $1,090,000 | $1,198,259 | 99 | 17 | 101.0% | 12.5% | 14.8% | -15.4% | 5.8% | 8.7% | -15.4% |
| Hayward | $610,000 | $620,318 | 70 | 26 | 101.9% | -0.2% | 2.7% | 2.9% | -2.6% | -4.9% | -5.4% |
| Livermore | $769,000 | $881,518 | 73 | 16 | 99.8% | 8.6% | 12.7% | -14.1% | 1.3% | 7.0% | -13.1% |
| Newark | $821,000 | $818,604 | 23 | 13 | 102.0% | 7.3% | 3.0% | 0.0% | 8.4% | 8.5% | -4.2% |
| Oakland | $755,000 | $851,142 | 189 | 24 | 110.8% | 7.4% | 1.9% | 0.0% | -0.7% | -0.7% | 4.4% |
| Piedmont | $1,961,500 | $2,209,357 | 14 | 12 | 0.0% | -25.9% | -20.6% | 16.7% | -8.8% | -10.5% | 55.6% |
| Pleasanton | $1,150,000 | $1,325,721 | 61 | 15 | 98.7% | 13.3% | 6.5% | 3.4% | 4.5% | 3.7% | 22.0% |
| San Leandro | $635,000 | $678,187 | 43 | 18 | 104.0% | 9.5% | 13.2% | 10.3% | 2.4% | 8.8% | -8.5% |
| San Lorenzo | $552,500 | $563,708 | 12 | 20 | 105.5% | 2.3% | 4.5% | -7.7% | -8.2% | -2.1% | 20.0% |
| Union City | $840,000 | $881,962 | 26 | 19 | 100.4% | 7.3% | 11.5% | -27.8% | 3.4% | 8.9% | 0.0% |
| April Sales Statistics | |||||||||||
| (Condos/Town Homes) | |||||||||||
| Prices | Unit | Change from last year | Change from last month | ||||||||
| Median | Average | Sales | DOM | SP/LP | Median | Average | Sales | Median | Average | Sales | |
| County | $586,000 | $610,364 | 275 | 17 | 105.4% | 10.6% | 10.9% | -3.2% | 2.7% | 1.9% | 3.0% |
| Alameda | $675,000 | $718,742 | 19 | 13 | 108.8% | 1.0% | 11.6% | 58.3% | 17.2% | 16.9% | 35.7% |
| Albany | $499,000 | $512,500 | 3 | 52 | 98.1% | 10.0% | 12.9% | 50.0% | -7.1% | -5.0% | 0.0% |
| Berkeley | $950,000 | $1,070,611 | 9 | 14 | 124.2% | 50.2% | 58.9% | 50.0% | 52.9% | 35.7% | 350.0% |
| Castro Valley | $757,000 | $753,400 | 5 | 17 | 105.0% | 37.6% | 36.1% | -70.6% | 42.8% | 55.8% | 0.0% |
| Dublin | $670,000 | $668,231 | 41 | 16 | 101.5% | 4.9% | 2.0% | 70.8% | -1.3% | 0.3% | 24.2% |
| Emeryville | $570,000 | $563,273 | 11 | 15 | 107.4% | 23.4% | 20.8% | 10.0% | 5.3% | 14.0% | -15.4% |
| Fremont | $606,000 | $604,359 | 44 | 17 | 104.2% | 5.1% | 0.0% | -12.0% | -16.9% | -14.9% | 22.2% |
| Hayward | $461,500 | $465,062 | 20 | 13 | 102.7% | 24.7% | 18.0% | -31.0% | -5.5% | -9.7% | -20.0% |
| Livermore | $574,000 | $599,189 | 14 | 14 | 101.0% | 6.3% | 26.9% | 7.7% | 17.2% | 2.5% | -17.6% |
| Newark | $535,000 | $553,398 | 11 | 12 | 102.1% | 3.4% | 8.9% | -8.3% | -2.8% | -1.8% | 0.0% |
| Oakland | $625,000 | $648,706 | 47 | 20 | 109.2% | 12.1% | 7.1% | -28.8% | 3.0% | -1.6% | -25.4% |
| Pleasanton | $545,000 | $584,647 | 17 | 15 | 100.6% | -3.4% | -2.9% | 54.5% | 1.7% | -5.2% | 30.8% |
| San Leandro | $390,000 | $398,446 | 17 | 33 | 102.5% | 2.6% | 8.1% | 13.3% | -0.6% | 1.3% | 54.5% |
| Union City | $460,000 | $471,926 | 15 | 11 | 104.3% | -5.6% | 0.5% | -6.3% | -3.6% | -5.3% | -21.1% |
May 5, 2017 -- The calendar turns another month, and another month of lower-than-expected mortgage rates passes by. Although there is not much by way of a relationship between the federal funds rate and mortgage rates, one might think that a growing economy coupled with firming inflation and a more active central bank would see mortgage rates ticking higher as we go. So far this year, that's not been the case.
Blame it again on weak first quarter growth, fading optimism about the Trump administration's ability to quickly move the needle on health care, tax and regulatory policy, global investors still looking for places to park funds during rocky political times or whatever you might like. Regardless of the reason, however, this can't go on forever.
In the statement released at the close of the meeting, the Fed noted that the economy again started the year in a lackluster fashion, but believes that the slowness is "transitory"; as well, the Fed noted that "inflation is running close" to its 2 percent target of late, and the combination of the two were a strong suggestion that the Fed will not deviate from what is expected to be another two (or more) hikes in rates this year. Futures markets now reckon almost an 80 percent chance of a rate hike at the next meeting in mid-June. Given the prospects of this, and in expectation that data coming in for April and May will likely be improved relative to that from March and February, it's more likely than not that mortgage and other interest rates will start to creep their way higher in the coming weeks.
Given the economy's poor performance in the first quarter, at least some investors were betting on a bit of softening of the Fed's stance in regards to a June move for rates. However, since the Fed didn't change its tone regarding the prospects for another rate hike in just six weeks' time, a bit of a readjustment in the influential rates that underlie mortgages took place at the end of the week. This move should be good enough to get us at least started down the road to somewhat higher mortgage rates next week, and probably beyond. The steps will probably be small, and may not even be regular, but the overall effect is that rates will trend higher as June beckons. To that end, we think a 3-4 basis point rise will get us started in that direction when Freddie Mac reports rates next week.
By: Lisa Johnson Mandell
You’ve finally found it: a home you’re swooning over and dying to own. From the exposed ceiling beams to the hardwood floors, this feels like the place. So what’s next? Don’t just stand there dumbstruck; it’s time to dig deeper and ask questions—and not just the kind that randomly pop into your head, either. You need to hit all of the necessary topics head-on, and some of them are not so obvious.
But you’re in luck: We’ve pulled together a checklist of some of the most important initial questions to ask when buying a home:
What is the home’s sales history?
When was the last time the house sold, and how much did the current owners pay for it? This is essential intel, and you don’t even have to ask the seller or your real estate agent about it, because it’s posted on every MLS listing. All you have to do is scroll down to find it. But make sure you know it.
When buying a home, the previous sale price will give you a sense of what the sellers might expect you to pay—but keep in mind that a home’s true market value is based more on what comparable homes are selling for now rather than what it went for in the past, says Los Angeles Realtor® Jennifer Niman of Berkshire Hathaway HomeServices. Sales history will also show you whether the home’s price has been trending up or down over time, which can help you hone your negotiating stance.
Did the sellers make any major renovations or additions?
If they’ve overhauled the kitchen, added a bedroom, or finished the basement, you’ll want to know that—and, ideally, see receipts from contractors to get a sense of what they paid for these upgrades.
In general, this will give you a ballpark notion of how much money they’ve sunk into the home—and what they hope to get out. That said, don’t assume you have to fork over as much cash as they put in; home improvements generally reap only a 64% return on average. And that return on investment varies widely based on which renovation is done.
How much are the property taxes?
Property tax history is also typically available right on the listing detail page. If you can’t find it, ask the seller. You’ll want to find out what previous owners paid, but understand that the property tax, since it’s based on a percentage of the value of the house, will probably be affected by your purchase price. This could be a huge additional expense, and you’ll need to budget for that when putting together your offer.
What are the monthly maintenance and utility costs?
Is there any type of homeowners association fee? Find out. Also learn what kind of power the house uses, be it gas, oil, electric, or a combination, and ask what the average monthly bill for each is. Also inquire about water, waste removal, and any other utility costs that are applicable.
Has there ever been a broken pipe? Sewer backup?
This may sound trivial (not to mention unpleasant), but according to the Insurance Information Institute, broken pipes account for an estimated 22% of all home insurance losses. If the homeowner doesn’t ‘fess up, a good home inspector can probably find evidence of either one of these situations, so you might want to put these on your list of questions to ask your inspector, too.
How old is the roof?
The 2015 Remodeling Impact Report from the NATIONAL ASSOCIATION OF REALTORS® says the national median cost of an asphalt roofing replacement is about $7,600. It would be good to know how soon you might need to lay out that substantial amount of cash.
Have there ever been any pest infestations?
If there was an infestation, when were pest control procedures undertaken? No, this won’t necessarily mean the house is pest-free at the time you’re buying it, but it’s a good starting point to know the history. Many buyers require that termite treatment be included in the price; it’s easiest to tent for pest removal when the house is empty, between owners.
Are there warranties on the appliances, HVAC system, garage door, etc.?
And if so, can the homeowner provide the documentation? Ask for it. This can establish how old these features are, and give you an idea of when they might need to be replaced and how expensive it could be. It will also help you decide whether or not to buy a home warranty.
What are the parking restrictions around the house?
Will guests need parking permits? How many permits are you, as the homeowner, allowed, and can you obtain more if you decide to throw a party? Also, check out the parking situation on the property itself. Will your car(s) fit in the garage? Is there room to park anywhere else on the property other than the driveway?
Does the house have any kind of unusual history?
In many states, owners are legally bound to disclose if a death or major crime has occurred recently on the premises, but there are other circumstances you should be aware of as well. For example: Did anyone famous ever live there? Was it ever used in a film, TV series, or commercial? If so, you might have to deal with fans ringing your doorbell or driving by at all hours of the day or night.
Oh, and if the house has a history of being haunted or paranormally “stigmatized,” you might have a little extra negotiating power when buying a home. Thanks, ghosts.
This page is copyrighted by https://rereport.com. All rights are reserved.