Statistical Tables | Damped Enthusiasm
| Trends at a Glance | |||
| (Single-family Homes) | |||
| Mar 26 | Feb 26 | Mar 25 | |
| Median Price: | $1,360,000 | $1,300,000 | $1,362,500 |
| Average Price: | $1,451,685 | $1,435,477 | $1,474,108 |
| Home Sales: | 584 | 446 | 630 |
| SP/LP Ratio: | 110.8% | 107.8% | 109.3% |
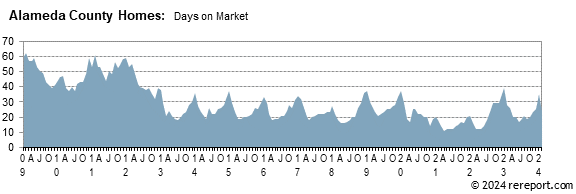
| Days on Market: | 18 | 26 | 16 |
| (Condos/Townhomes) | |||
| Mar 26 | Feb 26 | Mar 25 | |
| Median Price: | $690,000 | $681,000 | $776,000 |
| Average Price: | $737,493 | $751,891 | $808,717 |
| Condo Sales: | 202 | 162 | 209 |
| SP/LP Ratio: | 102.0% | 101.2% | 101.6% |
| Days on Market: | 40 | 39 | 29 |
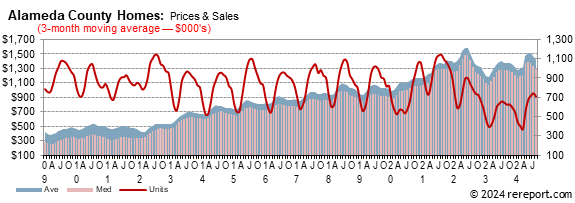
Sales of single-family, re-sale homes fell 7.3% from last year. There were 446
homes sold in Alameda County last month. The average since 2000 is 921.
The average sales price for
single-family, re-sale homes fell
1.5%
year-over-year.
It was up 1.1% from February.
The median sales price for
single-family, re-sale homes was down 0.2% year-over-year.
It was up 4.6% from February.
The sales price to list price ratio rose from 107.8% to 110.8%.
Homes sold in eighteen days. This is the time from being listed to going under
contract.
The average sales price for condos was down 8.8% year-over-year. It was down
1.9% from February. The median sales price was down 11.1% year-over-year but it
was up 1.3% month-over-month.
The sales price to list price ratio for condos rose from 101.2% to 102%.
Condo sales were down 3.3% from last year. There were 202 condos sold.
Condos sold on average in forty days.
Momentum Statistics
Sales momentum…
for
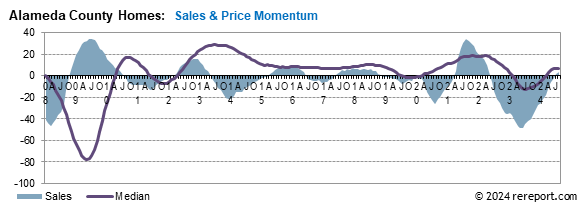
single-family homes fell 1.5 points to –2.5.
Pricing momentum…
for single-family homes rose 0.3 of a point to -1.6.
Our momentum statistics are based on 12-month moving averages to eliminate
monthly and seasonal variations.
This is an extraordinarily tough market for buyers. It's important to be calm
and realistic. If you don't know what to do or where to begin, give me a call
and let's discuss your situation and your options.
If you’re looking to sell, call me for a comprehensive Comparative Market
Analysis.
Our momentum statistics are based on 12-month moving averages to eliminate monthly and seasonal variations.
This is an extraordinarily tough market for buyers. It's important to be calm and realistic. If you don't know what to do or where to begin, give me a call and let's discuss your situation and your options.
If you’re looking to sell, call me for a comprehensive Comparative Market Analysis.
the blue area shows momentum for home sales while the purple line shows momentum for pending sales of single-family, re-sale homes. The purple line shows momentum for the median price.
This is an extraordinarily tough market for buyers. It's important to be calm and realistic. If you don't know what to do or where to begin, give me a call and let's discuss your situation and your options.


The real estate market is very hard to generalize. It is a market made up of many micro markets. For complete information on a particular neighborhood or property, call me.
If I can help you devise a strategy, call or click the buying or selling link in the menu to the left.
Complete monthly sales statistics for the Alameda County are below. Monthly graphs are available for each city in the county.
| March Sales Statistics | |||||||||||
| (Single-family Homes) | |||||||||||
| Prices | Unit | Change from last year | Change from last month | ||||||||
| Area | Median | Average | Sales | DOM | SP/LP | Median | Average | Sales | Median | Average | Sales |
| County | $1,360,000 | $1,451,685 | 584 | 18 | 110.8% | -0.2% | -1.5% | -7.3% | 4.6% | 1.1% | 30.9% |
| Alameda | $1,200,000 | $1,588,864 | 11 | 49 | 105.2% | -7.7% | 16.0% | -59.3% | -23.5% | -1.8% | -45.0% |
| Albany | $1,325,000 | $1,411,230 | 9 | 28 | 114.1% | -18.0% | -16.1% | 50.0% | -14.9% | -7.4% | 125.0% |
| Berkeley | $1,605,000 | $1,791,140 | 50 | 38 | 103.5% | -5.6% | -1.5% | -15.3% | 9.4% | 10.2% | 66.7% |
| Castro Valley | $1,319,000 | $1,216,956 | 27 | 34 | 102.6% | -0.5% | -15.0% | -12.9% | 14.3% | 3.6% | 35.0% |
| Dublin | $1,650,000 | $1,671,307 | 25 | 43 | 103.7% | -0.5% | -11.8% | -3.8% | 6.1% | -10.8% | 108.3% |
| Fremont | $1,750,000 | $1,852,826 | 72 | 34 | 109.6% | -5.3% | -3.4% | -5.3% | 1.7% | -7.1% | 35.8% |
| Hayward | $960,000 | $1,066,366 | 45 | 57 | 106.0% | 2.1% | 2.3% | 18.4% | -3.0% | -8.4% | 21.6% |
| Livermore | $1,237,500 | $1,409,384 | 56 | 40 | 102.2% | -1.8% | 1.9% | -16.4% | -6.5% | -7.0% | 27.3% |
| Newark | $1,491,194 | $1,560,745 | 22 | 46 | 107.5% | 5.7% | 6.7% | 10.0% | 2.8% | -1.4% | 46.7% |
| Oakland | $1,100,000 | $1,245,894 | 163 | 49 | 112.3% | 4.8% | 13.1% | -10.4% | 33.3% | 20.2% | 32.5% |
| Piedmont | $3,000,000 | $2,854,375 | 12 | 27 | 110.6% | -11.2% | -13.7% | 0.0% | 22.4% | -21.7% | 33.3% |
| Pleasanton | $1,530,000 | $1,967,547 | 27 | 39 | 101.9% | -15.3% | -1.9% | -48.1% | -19.5% | -7.9% | 8.0% |
| San Leandro | $840,000 | $885,245 | 33 | 38 | 105.5% | -4.0% | 2.2% | 13.8% | 10.2% | 10.0% | 37.5% |
| San Lorenzo | $820,000 | $824,727 | 11 | 39 | 104.6% | -5.7% | -10.5% | 22.2% | -0.7% | -0.8% | -26.7% |
| Union City | $1,465,000 | $1,464,194 | 20 | 38 | 108.1% | -3.9% | -5.6% | -16.7% | -2.1% | -3.5% | 53.8% |
| March Sales Statistics | |||||||||||
| (Condos/Town Homes) | |||||||||||
| Prices | Unit | Change from last year | Change from last month | ||||||||
| Median | Average | Sales | DOM | SP/LP | Median | Average | Sales | Median | Average | Sales | |
| County | $690,000 | $737,493 | 202 | 40 | 102.0% | -11.1% | -8.8% | -3.3% | -1.9% | 1.3% | 24.7% |
| Alameda | $915,000 | $912,500 | 17 | 57 | 105.7% | -0.3% | -5.9% | 6.3% | 5.5% | 6.6% | 70.0% |
| Albany | $505,000 | $505,000 | 1 | 54 | 99.0% | 17.7% | 17.2% | -66.7% | -29.9% | -29.9% | -50.0% |
| Berkeley | $760,000 | $978,675 | 7 | 48 | 123.1% | -8.0% | 23.0% | -30.0% | 22.2% | 21.6% | 0.0% |
| Castro Valley | $517,500 | $561,500 | 6 | 82 | 99.0% | -35.5% | -29.0% | 50.0% | -7.2% | -14.5% | 500.0% |
| Dublin | $825,000 | $876,577 | 13 | 58 | 99.5% | -3.5% | -2.3% | -55.2% | -16.3% | -22.3% | 8.3% |
| Emeryville | $334,000 | $397,500 | 10 | 100 | 103.3% | -36.9% | -24.9% | 0.0% | 10.8% | -4.6% | 42.9% |
| Fremont | $728,000 | $881,037 | 33 | 49 | 100.8% | -14.3% | -8.7% | -10.8% | -4.5% | -19.1% | 0.0% |
| Hayward | $664,500 | $666,996 | 28 | 91 | 101.1% | -18.0% | -15.1% | 33.3% | 14.6% | 17.1% | 40.0% |
| Livermore | $730,000 | $676,813 | 16 | 69 | 100.5% | -7.0% | -9.8% | -23.8% | -3.1% | 12.3% | 45.5% |
| Newark | $725,000 | $761,100 | 10 | 95 | 99.3% | -32.2% | -23.2% | -16.7% | -34.3% | -41.8% | 150.0% |
| Oakland | $560,000 | $639,044 | 45 | 71 | 101.5% | -7.4% | 3.9% | -4.3% | 11.0% | 6.2% | 50.0% |
| Pleasanton | $830,000 | $862,500 | 8 | 79 | 98.8% | 24.6% | 27.3% | -20.0% | -13.0% | 4.2% | -20.0% |
| San Leandro | $539,000 | $539,000 | 2 | 101 | 98.4% | 0.5% | 1.7% | -75.0% | 9.0% | 19.8% | -77.8% |
| Union City | $757,500 | $740,129 | 6 | 46 | 99.8% | -6.0% | -3.0% | -40.0% | 1.1% | 2.4% | -14.3% |
March 27, 2026 --
Just a few short weeks ago, an improved spring housing season seemed to be
coming into focus. Mortgage rates had just touched multi-year lows, inventories
of homes available for purchase were in perhaps their best state in some time,
moderating home price increases and gradually rising incomes were more routinely
helping to narrow the affordability gap. Now, perhaps the most important
component of that group is no longer lending support to the housing equation,
and the prospects for the spring market have been dimmed.
While the increase in mortgage rates hasn't been huge by any standard, what
seems likely to ultimately be at least a half-point rise at a minimum certainly
isn't welcome. Sales of existing homes were slogging along just above the 4
million annualized mark through last summer, when mortgage rates were a bit
higher than present, but accelerated as rates took a step downward and held
there through the end of 2025. Holidays and wicked winter weather prevented any
kind of "preseason" follow-through in January and February, but conditions were
in place for a reasonable pickup in sales for March and beyond. Unfortunately,
higher mortgage rates at exactly the wrong time are imperiling the chances of
this happening.
It's not only concerns about inflation that have fostered the rise, but also a
unwinding of expectations of the path of monetary policy this year. Just over a
week ago, Fed members collectively forecast that they still expected to be
trimming rates at least 25 basis points by the end of the year; however,
investors don't seem to believe them. The expected path for the federal funds
rate as foreseen by futures markets not only doesn't expect rate cuts to come
this year but now also features a small but meaningful chance that a hike by the
end of the year will come. Along with the effects of already-stubborn inflation,
this change in investor sentiment has helped long-term rates to firm up, and
this before the oil-fueled effects on prices has yet to be seen.
In considering the spring housing market, at least one helpful factor is likely
to remain in place, and that's the mellowing of home price increases over time.
Costs for newly constructed homes peaked a few years ago amid significant supply
shortages but have generally retreated since then. Coupled with builder
financing supports and other concessions, affordability conditions for new homes
has actually improved a fair bit (at least in a relative sense) when compared
against conditions in the existing housing market.
Existing home prices have seen their typical seasonal wax and wane over the last
few years, but have managed to set new record highs in June each year since the
pandemic. That said, increases in median selling prices have turned much more
meager of late, with year-ago comparisons showing only modest rises in each of
the last three months. While there is likely to be some acceleration in prices
this spring as is typical, there is a chance that a new record for median
selling prices for existing homes won't be set this year, given what is likely
to be somewhat less momentum in them as the spring progresses.
Financial markets continue to be buffeted and battered by adverse conditions,
perhaps more so outside the U.S. but certainly reflected here. The yields which
most affect long-term mortgage rates continued on their upward path this week,
resulting in a greater-than-expected increase in mortgage rates. Unfortunately,
that upward pressure didn't abate as markets closed the week, and that sets the
stage for somewhat higher mortgage rates again next week. We've been
consistently undershooting the magnitude of increase in rates each week since
the conflict in Iran began, and continue to hope that won't be the case for
long. Perhaps optimistically, we think that the average offered rate for a
conforming 30-year fixed-rate mortgage as reported by Freddie Mac will see an 8
to 11 basis point increase next week. We hope this expectation is on the high
side for a change.
This page is copyrighted by https://rereport.com. All rights are reserved.