
| Trends at a Glance | |||
| (Single-family Homes) | |||
| Dec 06 | Nov 06 | Dec 05 | |
| Home Sales: | 205 | 212 | 227 |
| Median Price: | $812,990 | $825,000 | $815,000 |
| Average Price: | $1,018,977 | $1,066,261 | $1,044,587 |
| Sale/List Price Ratio: | 100.9% | 100.7% | 103.3% |
| Days on Market: | 47 | 41 | 42 |
The median price for single-family homes in San Francisco was flat at $850,000. The average price for homes gained 2.2%. The median price for condos fell 1.4% to $700,000, while the average price also lost 1.4% to $795,394.
Home sales fell for the third year in a row, dropping 15.5% from the year before. Condo sales were down for the second year in a row, losing 13.6% from 2005.
For the full report, and our predictions for next year, click on Annual Trends to the left.
The median price for single-family homes in San Francisco ended the year just a step above the yearly low, which was set back in January. The median price fell 1.5% from the month before to $812,990, and was off 0.2% from last December.
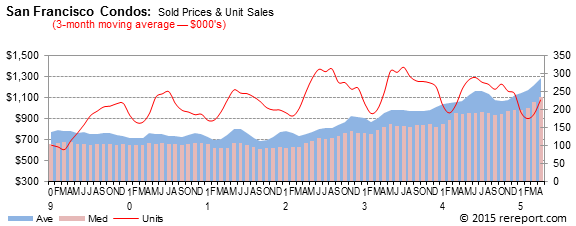
Condo prices, on the other hand, ended the year on an upward trend. The median price rose 2.9% to $771,500, a year-over-year gain of 2.2%. The average price surged by 11.2% to $821,852, up 10.9% compared to last December.
Home sales continued to be weak, with year-over-year losses extending their streak to twenty-one months. Although condo sales were down 9.6% from November, they show a year-over-year gain of 7.5%.

Sales price to list price ratios rose in December for single-family homes, up 0.2 of a point to 100.9%. The ratio for condos gained 4.9 points to 101.7%.
The real estate market is very hard to generalize. It is a market made up of many micro markets. For complete information on a particular neighborhood, call me.
If I can help you devise a strategy, call or click the buying or selling link in the menu to the left.
Complete monthly sales statistics for San Francisco are below. Monthly graphs are available for each district in the city by clicking the links to the left.
| December Sales Statistics | ||||||||
| (Single-family Homes) | ||||||||
| Prices | Unit | Change from last year | ||||||
| Median | Average | Sales | DOM | SP/LP | Median | Average | Sales | |
| San Francisco | $812,990 | $1,018,977 | 205 | 47 | 99.4% | -0.2% | -2.5% | -9.7% |
| Northwest | $875,000 | $1,428,477 | 16 | 77 | 94.9% | -3.8% | 32.3% | -11.1% |
| Central West | $780,000 | $805,578 | 33 | 37 | 100.9% | 2.0% | -0.2% | -26.7% |
| Southwest | $754,700 | $753,392 | 16 | 41 | 99.7% | 8.7% | -8.6% | -15.8% |
| Twin Peaks | $840,000 | $1,035,043 | 36 | 37 | 101.1% | -2.3% | -0.6% | 24.1% |
| Central | $749,000 | $1,142,620 | 25 | 54 | 99.1% | -10.0% | -3.8% | -24.2% |
| Central North | $750,000 | $1,404,333 | 3 | 91 | 89.8% | -54.3% | -14.3% | 50.0% |
| North | $1,237,500 | $4,241,000 | 5 | 32 | 98.2% | -40.4% | 42.8% | -37.5% |
| Northeast | $870,000 | $2,250,000 | 1 | 67 | 100.0% | 12.3% | -53.1% | -75.0% |
| Central East | $766,000 | $903,642 | 30 | 48 | 99.5% | 12.6% | 10.4% | 36.4% |
| Southeast | $634,000 | $669,800 | 40 | 50 | 102.1% | -7.8% | -1.8% | -14.9% |
| December Sales Statistics | ||||||||
| (Condos/TICs/Co-ops/Lofts) | ||||||||
| Prices | Unit | Change from last year | ||||||
| Median | Average | Sales | DOM | SP/LP | Median | Average | Sales | |
| San Francisco | $771,500 | $821,852 | 245 | 63 | 101.7% | 2.2% | 10.9% | 7.5% |
| Northwest | $875,000 | $827,182 | 22 | 74 | 98.6% | -3.8% | 4.0% | 144.4% |
| Central West | - | - | - | - | - | n/a | n/a | n/a |
| Southwest | $754,700 | $612,500 | 2 | 20 | 98.2% | 8.7% | 30.3% | -33.3% |
| Twin Peaks | $840,000 | $544,767 | 7 | 77 | 98.9% | -2.3% | -4.4% | 40.0% |
| Central | $749,000 | $705,742 | 62 | 61 | 100.6% | -10.0% | -9.2% | 31.9% |
| Central North | $750,000 | $684,500 | 26 | 54 | 98.8% | 4.9% | -4.4% | -3.7% |
| North | $1,237,500 | $1,262,400 | 25 | 56 | 117.5% | 33.8% | 37.3% | -10.7% |
| Northeast | $870,000 | $1,015,971 | 34 | 81 | 98.8% | 12.3% | 30.5% | 0.0% |
| Central East | $766,000 | $799,557 | 57 | 55 | 98.5% | 12.6% | 16.4% | -8.1% |
| Southeast | $634,000 | $488,658 | 10 | 75 | 100.0% | -7.8% | -5.2% | 100.0% |
This page is copyrighted by https://rereport.com. All rights are reserved.