
| Trends at a Glance | |||
| (Single-family Homes) | |||
| Dec 10 | Nov 10 | Dec 09 | |
| Home Sales: | 213 | 171 | 192 |
| Median Price: | $725,000 | $785,000 | $755,608 |
| Average Price: | $1,032,020 | $1,042,605 | $953,530 |
| Sale/List Price Ratio: | 98.9% | 99.3% | 99.5% |
| Days on Market: | 65 | 59 | 68 |
| (Lofts/Townhomes/TIC) | |||
| Dec 10 | Nov 10 | Dec 09 | |
| Condo Sales: | 191 | 155 | 220 |
| Median Price: | $630,000 | $679,000 | $672,500 |
| Average Price: | $731,599 | $778,639 | $752,521 |
| Sale/List Price Ratio: | 97.3% | 97.6% | 97.5% |
| Days on Market: | 95 | 79 | 98 |
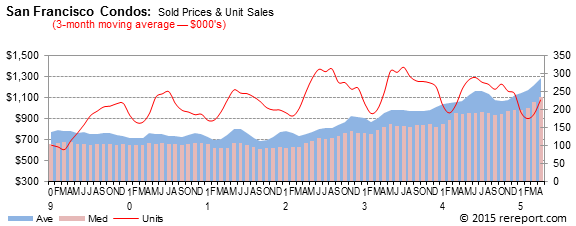
Both single-family, re-sales homes and condo/loft sales were strong in 2010. Home sales increased for the second year in a row and were up 7.5% over 2009. Condo/loft sales rose for the first time since 2004: up 14.9%.
Home prices turned around last year after two years of declines. The median price for homes in 2010 rose 1.4% while the average price was up 4.6%. The median price for condos/lofts was down for the third year: 5.8%. The average price gained 0.9%.
Although sales were strong last year, sales momentum for single-family, re-sale homes in San Francisco started weakening the last half of the year. In December, sales momentum was at +7%. (See chart below)
Click on Annual Trends for the 2010 Annual Report and C.A.R.'s forecast for 2011.
sales momentum by using a 12-month moving average to eliminate seasonality. By comparing this year�s 12-month moving average to last year�s, we get a percentage showing market momentum.
the green shows momentum for home sales while the purple line shows momentum for the median price for single-family, re-sale homes.
after peaking in October, dropped to +3% last month.
The median sales price for single-family, re-sale homes ended the year on a down note, dropping 7.6% from November. Year-over-year, the median price was off 4.1%. This is the fourth month in a row the median price has been lower than the year before. The average price was up 8.2% compared to last December.
Home sales ended the year strong, up 24.6% from November. The 213 homes sold last month were the largest number of sales since June. After five months in a row where sales were lower than the year before, last month saw an increase of 10.9%.
The sales price to list price ratio was down 0.4 of a point to 98.9%.
The median sales price for re-sale condos/lofts fell 7.2% in December compared to November. Year-over-year, the median price was off 6.3%.
Condo/loft sales rose 23.2% in December compared to November, but were off 13.2% year-over-year. This is the sixth month in a row condo/loft sales have been lower than the year before.
The sales price to list price ratio was down 0.3 of a point to 97.3%.
Remember, the real estate market is a matter of neighborhoods and houses. No two are the same. For complete information on a particular neighborhood or property, call.

The graph below shows the sales price to list price ratio as reported at sale compared to the sales price to original list price ratio.
The following chart shows the median price difference compared to the year before.

Days on market for homes rose six days to 65 days. For condos/lofts, days on market soared sixteen days to 95 days.
The real estate market is very hard to generalize. It is a market made up of many micro markets, especially in San Francisco. For complete information on a particular neighborhood or property, or for an evaluation of your home's worth, call me.
If I can help you devise a strategy, call or click the buying or selling link in the menu to the left.
Complete monthly sales statistics for San Francisco are below. Monthly graphs are available for each district in the city by clicking the links to the left.
| December Sales Statistics | |||||||||||
| (Single-family Homes) | |||||||||||
| Prices | Unit | Change from last year | Change from last month | ||||||||
| Median | Average | Sales | DOM | SP/LP | Median | Average | Sales | Median | Average | Sales | |
| San Francisco | $725,000 | $1,032,020 | 213 | 65 | 98.9% | -4.1% | 8.2% | 10.9% | -7.6% | -1.0% | 24.6% |
| D1: Northwest | $965,000 | $1,325,562 | 16 | 85 | 98.4% | 14.2% | 22.6% | 33.3% | -16.1% | -12.5% | 6.7% |
| D2: Central West | $661,000 | $703,900 | 32 | 52 | 99.5% | -14.8% | -11.0% | -11.1% | -4.9% | -3.2% | -11.1% |
| D3: Southwest | $460,768 | $534,954 | 10 | 78 | 95.8% | -19.4% | -14.8% | -37.5% | -16.2% | -17.6% | -37.5% |
| D4: Twin Peaks | $900,000 | $991,815 | 27 | 79 | 98.6% | 2.3% | 3.3% | 17.4% | 9.1% | 8.9% | 80.0% |
| D5: Central | $1,484,000 | $1,481,721 | 34 | 61 | 97.6% | 21.3% | 15.8% | 41.7% | 10.6% | 0.8% | 47.8% |
| D6: Central North | $1,100,000 | $1,177,000 | 5 | 94 | 95.1% | 13.4% | -8.2% | -44.4% | 113.6% | 128.5% | 400.0% |
| D7: North | $3,275,000 | $3,714,833 | 12 | 77 | 100.6% | -63.6% | -55.4% | 300.0% | 2.3% | 15.5% | 20.0% |
| D8: Northeast | $995,000 | $995,000 | 1 | 42 | 100.0% | 19.9% | 8.7% | -66.7% | -58.1% | -58.1% | -50.0% |
| D9: Central East | $756,500 | $731,511 | 22 | 68 | 100.2% | -3.6% | -10.7% | 4.8% | -7.2% | -16.0% | 4.8% |
| D10: Southeast | $499,000 | $482,042 | 53 | 56 | 99.7% | 1.8% | -2.9% | 17.8% | 0.0% | -2.0% | 71.0% |
| December Sales Statistics | |||||||||||
| (Condos/TICs/Co-ops/Lofts) | |||||||||||
| Prices | Unit | Change from last year | Change from last month | ||||||||
| Median | Average | Sales | DOM | SP/LP | Median | Average | Sales | Median | Average | Sales | |
| San Francisco | $630,000 | $731,599 | 191 | 95 | 97.3% | -6.3% | -2.8% | -13.2% | -7.2% | -6.0% | 23.2% |
| D1: Northwest | $769,500 | $713,417 | 6 | 98 | 97.8% | 6.9% | 4.4% | -68.4% | 18.8% | 11.7% | -25.0% |
| D2: Central West | $508,464 | $457,155 | 6 | 103 | 103.8% | -27.4% | -44.4% | 100.0% | -23.5% | -31.3% | 200.0% |
| D3: Southwest | $332,500 | $332,500 | 2 | 110 | 96.5% | 18.8% | 18.8% | 100.0% | 0.8% | 0.8% | 0.0% |
| D4: Twin Peaks | $415,000 | $461,188 | 8 | 123 | 97.2% | 14.7% | 2.2% | 166.7% | -44.1% | -37.8% | 700.0% |
| D5: Central | $735,000 | $822,166 | 35 | 95 | 99.4% | 5.2% | 19.1% | -22.2% | -0.4% | -0.2% | 29.6% |
| D6: Central North | $620,000 | $665,667 | 9 | 115 | 97.8% | -7.7% | 3.0% | -55.0% | 3.5% | 6.7% | -64.0% |
| D7: North | $1,000,000 | $1,092,342 | 19 | 102 | 95.9% | -8.7% | -17.4% | -17.4% | 14.3% | 2.5% | -9.5% |
| D8: Northeast | $640,000 | $763,796 | 38 | 87 | 95.4% | -1.5% | 0.1% | -15.6% | -8.4% | -13.4% | 31.0% |
| D9: Central East | $539,000 | $659,874 | 63 | 90 | 97.5% | -11.6% | -1.2% | 10.5% | -14.9% | -5.5% | 65.8% |
| D10: Southeast | $452,500 | $434,973 | 4 | 93 | 97.5% | 12.4% | 5.2% | 0.0% | 85.2% | 78.1% | 100.0% |
This page is copyrighted byhttps://rereport.com. All rights are reserved.