
| Trends at a Glance | |||
| (Single-family Homes) | |||
| Oct 11 | Sep 11 | Oct 10 | |
| Home Sales: | 190 | 192 | 199 |
| Median Price: | $741,500 | $672,500 | $733,000 |
| Average Price: | $995,590 | $883,112 | $936,034 |
| Sale/List Price Ratio: | 100.3% | 100.3% | 99.1% |
| Days on Market: | 51 | 62 | 56 |
| (Lofts/Townhomes/TIC) | |||
| Oct 11 | Sep 11 | Oct 10 | |
| Condo Sales: | 176 | 183 | 193 |
| Median Price: | $644,500 | $598,199 | $675,000 |
| Average Price: | $701,570 | $686,094 | $757,881 |
| Sale/List Price Ratio: | 98.2% | 98.1% | 98.0% |
| Days on Market: | 75 | 83 | 84 |
The Home Affordable Refinance Program, or HARP, is being revamped.
It was originally aimed at a housing market that had an estimated 5 million struggling homeowners. Unfortunately, HARP�s original terms and limits were so restrictive that the program, to date, has reached fewer than 900,000 mortgage holders. The major restriction eliminated any homeowner whose existing mortgage represented more than 125% of the loan-to-value of their home.
The revamping of HARP will let borrowers whose mortgages are backed by Fannie Mae and Freddie Mac refinance those underwater mortgages, presumably no matter how far their home�s value has fallen. In fact, current loan-to-value ratio on the existing mortgage must be greater than 80 percent.
And, mortgage holders can�t double-dip; that is, if they already have an earlier HARP loan, they can�t get another at the even better rate of 4%. The new terms also eliminate the need for yet another property appraisal in calculating LTV, and the program�s end date has been extended.
The plan, announced last week still has certain eligibility limits. For example, your mortgage has to be a Fannie Mae or Freddie Mac instrument, owned or guaranteed by one agency or the other, and you must not have missed any payments in the last six months (since April 24, at present), or have more than one missed payment over the last year.
The FHFA, or Federal Housing Finance Agency, which currently controls Fannie, Freddie, and 12 other Federal Home Loan Banks � located in Atlanta, Boston, Chicago, Cincinnati, Dallas, Des Moines, Indianapolis, New York, Pittsburgh, San Francisco, Seattle and Topeka - is expected to announce the final program parameters by November 15.
This is a much needed expansion of the program. Unfortunately, there are over ten million homeowners underwater and this new HARP will only be available to 10% of them.
Sales of single-family, re-sale homes were were down 4.5% year-over-year. Year-to-date, home sales are up 2.8%.
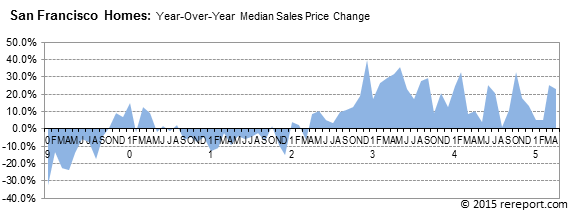
The median price for homes rose 10.3% month-over-month. Year-over-year, the median price was up 1.2%. This is the first month since last August that the median price has been higher than the year before.
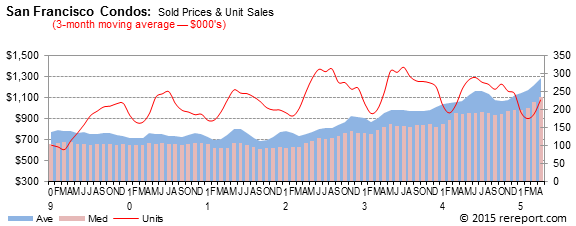
Condo/loft sales were down 8.8% year-over-year.
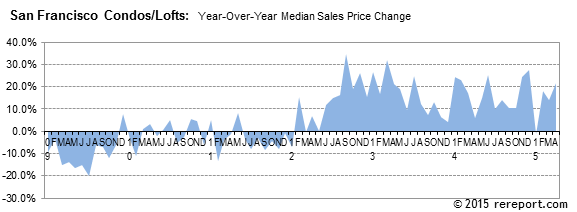
The median price for condos/lofts rose 7.7% from August, but was off 4.5% compared to last October.
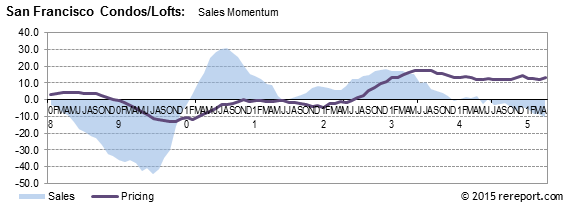
Home sales momentum rose one point to +3. Condo/loft momentum was flat at -1.
momentum by using a 12-month moving average to eliminate seasonality. By comparing this year�s 12-month moving average to last year�s, we get a percentage showing market momentum.
the green shows momentum for home sales while the purple line shows momentum for the median price for single-family, re-sale homes.
after peaking in September 2010, was also flat at -7. Pricing momentum for condos/lofts dropped one point to -2.
The graph below shows the sales price to list price ratio as reported at sale compared to the sales price to original list price ratio.

The following chart shows the median price difference compared to the year before.
Condo/loft sales dropped 8.8% year-over-year. Year-to-date, condo/loft sales are up 2%.
The graph below shows the sales price to list price ratio as reported at sale compared to the sales price to original list price ratio.
The following chart shows the median price difference compared to the year before.
The real estate market is very hard to generalize. It is a market made up of many micro markets, especially in San Francisco. For complete information on a particular neighborhood or property, or for an evaluation of your home's worth, call me.
If I can help you devise a strategy, call or click the buying or selling link in the menu to the left.
Complete monthly sales statistics for San Francisco are below. Monthly graphs are available for each district in the city by clicking the links to the left.
| October Sales Statistics | |||||||||||
| (Single-family Homes) | |||||||||||
| Prices | Unit | Change from last year | Change from last month | ||||||||
| Median | Average | Sales | DOM | SP/LP | Median | Average | Sales | Median | Average | Sales | |
| San Francisco | $741,500 | $995,590 | 190 | 51 | 100.3% | 1.2% | 6.4% | -4.5% | 10.3% | 12.7% | -1.0% |
| D1: Northwest | $1,328,788 | $1,631,752 | 14 | 50 | 101.2% | 35.6% | 51.0% | -48.1% | 36.3% | 30.0% | -12.5% |
| D2: Central West | $675,000 | $710,614 | 41 | 51 | 100.1% | -1.6% | 1.3% | 20.6% | -1.5% | 4.5% | 10.8% |
| D3: Southwest | $571,500 | $588,100 | 10 | 74 | 100.8% | 19.1% | 13.8% | 11.1% | 20.3% | 8.4% | -23.1% |
| D4: Twin Peaks | $824,750 | $895,827 | 26 | 43 | 102.3% | -1.2% | -13.3% | -3.7% | -3.5% | -10.7% | 18.2% |
| D5: Central | $1,423,250 | $1,437,357 | 28 | 43 | 100.0% | 3.1% | -1.0% | -6.7% | 5.4% | 1.5% | 21.7% |
| D6: Central North | $1,250,000 | $1,250,000 | 1 | 43 | 95.2% | -19.2% | -12.2% | -75.0% | n/a | n/a | n/a |
| D7: North | $2,447,000 | $3,007,556 | 9 | 48 | 99.2% | 16.5% | 23.8% | 80.0% | -0.1% | -8.0% | 80.0% |
| D8: Northeast | $1,860,000 | $2,516,750 | 3 | 86 | 94.7% | 46.2% | 97.8% | 50.0% | -46.7% | -27.9% | 50.0% |
| D9: Central East | $757,000 | $778,042 | 20 | 40 | 101.8% | -2.9% | -10.0% | -4.8% | 11.3% | -0.9% | 5.3% |
| D10: Southeast | $433,000 | $423,767 | 35 | 64 | 100.1% | -11.3% | -7.9% | -10.3% | -4.0% | -4.3% | -36.4% |
| October Sales Statistics | |||||||||||
| (Condos/TICs/Co-ops/Lofts) | |||||||||||
| Prices | Unit | Change from last year | Change from last month | ||||||||
| Median | Average | Sales | DOM | SP/LP | Median | Average | Sales | Median | Average | Sales | |
| San Francisco | $644,500 | $701,570 | 176 | 75 | 98.2% | -4.5% | -7.4% | -8.8% | 7.7% | 2.3% | -3.8% |
| D1: Northwest | $687,000 | $686,000 | 4 | 116 | 99.5% | 0.3% | -9.2% | -55.6% | 28.4% | 16.1% | -55.6% |
| D2: Central West | $745,750 | $695,875 | 4 | 75 | 99.6% | -21.9% | -27.1% | 100.0% | 30.8% | 22.1% | 300.0% |
| D3: Southwest | $221,500 | $221,500 | 2 | 141 | 99.6% | -29.7% | -38.5% | -33.3% | -19.2% | -20.5% | -66.7% |
| D4: Twin Peaks | $349,000 | $367,000 | 3 | 99 | 98.0% | -48.3% | -37.8% | -40.0% | 26.1% | 32.6% | 50.0% |
| D5: Central | $737,000 | $729,504 | 27 | 73 | 99.4% | -0.4% | -8.2% | -20.6% | 1.0% | 1.7% | -15.6% |
| D6: Central North | $680,000 | $650,474 | 19 | 58 | 100.4% | 2.9% | 0.4% | 18.8% | 5.4% | 3.1% | 0.0% |
| D7: North | $689,500 | $883,764 | 18 | 75 | 98.6% | -29.3% | -5.8% | -14.3% | -18.7% | -4.0% | 63.6% |
| D8: Northeast | $622,500 | $666,566 | 44 | 73 | 96.8% | -17.0% | -21.7% | 18.9% | 2.0% | -16.1% | 18.9% |
| D9: Central East | $660,000 | $745,089 | 51 | 74 | 97.7% | 8.7% | 1.4% | -10.5% | 14.3% | 11.9% | -20.3% |
| D10: Southeast | $242,500 | $278,250 | 4 | 101 | 96.2% | 54.8% | 42.5% | -20.0% | 23.7% | 42.0% | 100.0% |
This page is copyrighted byhttps://rereport.com. All rights are reserved.