
Statistical Tables | | The Labor Leg
| Trends at a Glance | |||
| (Single-family Homes) | |||
| Sep 22 | Aug 22 | Sep 21 | |
| Home Sales: | 170 | 183 | 238 |
| Median Price: | $ 1,650,000 | $ 1,600,000 | $ 1,750,000 |
| Average Price: | $ 1,895,515 | $ 1,938,756 | $ 2,118,465 |
| SP/LP: | 106.4% | 106.5% | 113.7% |
| Days on Market: | 25 | 25 | 22 |
| (Lofts/Townhomes/TIC) | |||
| Sep 22 | Aug 22 | Sep 21 | |
| Condo Sales: | 192 | 231 | 281 |
| Median Price: | $ 1,170,000 | $ 1,010,000 | $ 1,200,000 |
| Average Price: | $ 1,345,866 | $ 1,128,539 | $ 1,343,298 |
| SP/LP: | 100.4% | 100.4% | 105.0% |
| Days on Market: | 55 | 51 | 37 |
Sales momentum…
for homes dropped 2.9 points to
–13.8. Sales momentum for condos/lofts was down 2 points to –19.6.
Pricing momentum…
for single-family homes fell 0.9
of a point to +3.5. Pricing momentum for condos/lofts fell 0.2 of a point to
+1.7.
Our momentum statistics are based on 12-month moving averages to eliminate
monthly and seasonal variations.
If you are planning on selling your property, call me for a free comparative
market analysis.
momentum by using a 12-month moving average to eliminate seasonality. By comparing this year's 12-month moving average to last year's, we get a percentage showing market momentum.
the blue area shows momentum for home sales while the red line shows momentum for pending sales of single-family, re-sale homes. The purple line shows momentum for the average price.
As you can see, pricing momentum has an inverse relationship to sales momentum.
The graph below shows the median and average prices plus unit sales for homes.

Remember, the real estate market is a matter of neighborhoods and houses. No two are the same. For complete information on a particular neighborhood or property, call me.
P.S. The FHA requires all condo projects to be re-certified before they will make a loan. To find out if the condo project you're interested in is eligible, go here: https://entp.hud.gov/idapp/html/condlook.cfm.


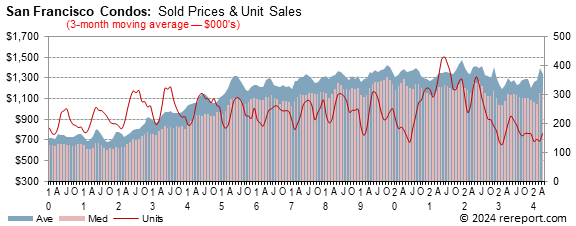
The graph below shows the median and average prices plus unit sales for condos/lofts.
The real estate market is very hard to generalize. It is a market made up of many micro markets. For complete information on a particular neighborhood or property, call me.
If I can help you devise a strategy, call or click the buying or selling link in the menu to the left.
Complete monthly sales statistics for San Francisco are below. Monthly graphs are available for each area in the city.
| September Sales Statistics | |||||||||||
| (Single-family Homes) | |||||||||||
| Prices | Unit | Yearly Change | Monthly Change | ||||||||
| Median | Average | Sales | DOM | SP/LP | Median | Average | Sales | Median | Average | Sales | |
| San Francisco | $1,650,000 | $1,895,515 | 170 | 25 | 106.4% | -5.7% | -10.5% | -28.6% | 3.1% | -2.2% | -7.1% |
| D1: Northwest | $2,099,444 | $2,115,319 | 20 | 47 | 110.3% | -22.0% | -32.5% | -16.7% | 8.6% | -15.6% | 100.0% |
| D2: Central West | $1,550,000 | $1,579,634 | 41 | 24 | 112.1% | -6.8% | -14.6% | -10.9% | -1.4% | -5.3% | 13.9% |
| D3: Southwest | $1,350,000 | $1,451,576 | 13 | 23 | 111.9% | -3.6% | -5.0% | -23.5% | -2.8% | 2.5% | -27.8% |
| D4: Twin Peaks | $1,800,000 | $2,180,698 | 27 | 26 | 104.8% | 0.1% | 8.0% | -3.6% | -4.0% | 8.9% | 3.8% |
| D5: Central | $2,637,500 | $2,602,885 | 13 | 23 | 104.3% | -10.6% | -8.4% | -63.9% | -12.8% | -15.1% | -51.9% |
| D6: Central North | $3,000,000 | $3,370,000 | 3 | 19 | 102.8% | 46.9% | 65.0% | 50.0% | 53.7% | 47.8% | -25.0% |
| D7: North | $3,450,000 | $3,584,361 | 8 | 28 | 102.2% | -44.6% | -42.8% | 33.3% | 3.0% | 2.6% | 33.3% |
| D8: Northeast | $3,725,000 | $3,725,000 | 2 | 38 | 86.3% | 11.7% | 11.7% | 0.0% | 122.4% | 122.4% | 0.0% |
| D9: Central East | $1,650,000 | $1,789,176 | 17 | 26 | 0.0% | -11.1% | -8.2% | -26.1% | -0.6% | -2.3% | 0.0% |
| D10: Southeast | $1,050,000 | $1,055,661 | 28 | 31 | 102.4% | -11.8% | -13.4% | -48.1% | -6.7% | -9.4% | -31.7% |
| September Sales Statistics | |||||||||||
| (Condos/TICs/Co-ops/Lofts) | |||||||||||
| Prices | Unit | Yearly Change | Monthly Change | ||||||||
| Median | Average | Sales | DOM | SP/LP | Median | Average | Sales | Median | Average | Sales | |
| San Francisco | $1,170,000 | $1,345,866 | 192 | 55 | 100.4% | -2.5% | 0.2% | -31.7% | 15.8% | 19.3% | -16.9% |
| D1: Northwest | $1,515,000 | $1,454,286 | 7 | 40 | 102.7% | 23.7% | 13.2% | -41.7% | 24.7% | 16.1% | -36.4% |
| D2: Central West | $1,557,500 | $1,557,500 | 2 | 32 | 96.2% | 45.6% | 43.8% | -33.3% | 93.5% | 78.4% | -33.3% |
| D3: Southwest | $852,000 | $874,000 | 3 | 13 | 102.9% | 15.9% | 18.9% | 50.0% | -33.7% | -32.0% | 50.0% |
| D4: Twin Peaks | $867,500 | $820,486 | 6 | 58 | 102.0% | 44.8% | 1.5% | 100.0% | 8.4% | 2.6% | 500.0% |
| D5: Central | $1,400,000 | $1,419,648 | 25 | 34 | 102.1% | -8.2% | -12.9% | -52.8% | 2.6% | 8.5% | -26.5% |
| D6: Central North | $1,101,871 | $1,121,883 | 17 | 42 | 102.4% | -13.2% | -21.8% | -48.5% | -2.7% | -5.6% | -50.0% |
| D7: North | $1,393,500 | $1,817,500 | 12 | 40 | 99.5% | -0.5% | -1.6% | -52.0% | 16.1% | 35.4% | -47.8% |
| D8: Northeast | $1,200,000 | $1,592,890 | 41 | 51 | 101.0% | 15.7% | 28.9% | -10.9% | 42.9% | 60.2% | 5.1% |
| D9: Central East | $1,100,000 | $1,250,699 | 71 | 64 | 0.0% | 7.3% | 6.8% | -25.3% | 18.3% | 13.9% | 2.9% |
| D10: Southeast | $780,000 | $742,500 | 6 | 176 | 98.7% | -1.6% | -5.6% | -25.0% | 25.8% | 7.9% | -45.5% |
Sept 30, 2022
-- Once the labor market begins to slow, inflation will likely start to decline.
Of course, the question is "when will that start to happen?", but outside of
"probably not too long from now", the timing is uncertain. It is perhaps the
last leg of an economic tripod that has yet to respond to the new economic
climate.
The strong bout of inflation helped foster the steepest rise in mortgage rates
in many decades, leaving them now at about 15-year highs. As might be expected,
the fast run-up in rates has crushed the housing market, first cutting off the
refinancing market, where skipping a monthly payment and then starting a new
loan with lower payments freed up billions of spendable dollars, further fueling
the economy and keeping aggregate demand high. Refinancing activity has declined
to about a 22-odd year now, and even higher mortgage rates of late will keep it
from returning anytime soon.
Homebuying was next. Already challenged by spiking home prices due to an
imbalance of supply and demand, the monthly payment increases that higher prices
and more-than-decade high mortgage rates brought have cooled home sales by 25%
or more. Although sales of new homes managed a bump for August, where a 28.8%
month-to-month increase put the annualized rate of sale at 685,000 units,
consider this to be a outlier in a downtrend that began in January. Mortgage
rates in August suddenly and unexpectedly had a short-but-significant drop, with
Freddie Mac's offered rate for a 30-year FRM ticking back to 4.99% for a brief
time. Folks in the market jumped at the chance to grab the lowest rate in
months, but this doesn't change the overall picture.
July's 532,000 annual rate of new home sales was 36% below the pace at the
beginning of the year, and even with the August improvement the decline is still
18%. Builders also moved likely inventory at a faster clip using discounts,
since the median price of a new single-family home sold last month was about
$33K less than one sold in July, a 6.3% month-to-month decline. Since that
temporary August low for rates, mortgage rates have risen almost 1.75 percentage
points and potential buyers have retreated.
We learned last week that sales of existing homes eased in August, posting a
0.4% drop to a 4.80 million annual rate, the slowest pace of existing sales in
more than eight years. This also represents as 26% decline from the start of
this year. With conditions for potential homebuyers worsening as the summer came
to a close, fewer contracts to purchase homes were executed in August, and the
National Association of Realtors Pending Home Sales Index declined by another 2%
last month. Declines in pending home sales have been notched in nine of the last
ten months, with only May's 0.4% increase breaking the string of slowness.
Leaving out the hard-stop months of the early pandemic, when it wasn't clear how
to buy homes at a time of extreme social distancing, the present value for the
PHSI is akin to that seen in May 2011, when the housing market was still a huge
mess.
So home sales have been crushed, which hurts a range of service-related
industries in real estate and finance. Despite a low-rate-infused August bump,
home construction has also slowed, dropping from a 1.78 million-unit annual rate
of construction in January to July's 1.40 million level (about a 21% drop, with
August still an 11.3% drop over that time). As new home construction influences
industries ranging from lumber to transportation, the drop in activity is likely
starting to slow a range of hard-goods industries.
It's not clear how much more slowing in housing the Fed would like to see. It's
not likely that they are hoping for widespread home value declines, which are
said to produce a kind of reverse wealth effect and curtailing consumer
spending, but how the market values a piece of real estate probably doesn't much
concern the Fed. At his press conference last week, Chairman Powell noted "For
the longer term what we need is supply and demand to get better aligned so that
housing prices go up at a reasonable level, at a reasonable pace, and that
people can afford houses again, and I think we, so we probably in the housing
market have to go through a correction to get back to that place." He went on to
say that "But from a sort of business cycle standpoint, this difficult
correction should put the housing market back into better balance."
For the moment, although increases in home prices are cooling, home values still
remain well supported.
This page is copyrighted by https://rereport.com. All rights are reserved.