
Statistical Tables | | Waiting For Change
| Trends at a Glance | |||
| (Single-family Homes) | |||
| Mar 24 | Feb 24 | Mar 23 | |
| Home Sales: | 162 | 127 | 148 |
| Median Price: | $1,725,000 | $1,550,999 | $1,697,500 |
| Average Price: | $2,173,925 | $2,024,040 | $2,282,230 |
| SP/LP: | 107.4% | 105.7% | 103.5% |
| Days on Market: | 25 | 34 | 28 |
| (Lofts/Townhomes/TIC) | |||
| Mar 24 | Feb 24 | Mar 23 | |
| Condo Sales: | 137 | 164 | 241 |
| Median Price: | $1,305,000 | $1,067,500 | $1,075,000 |
| Average Price: | $1,471,513 | $1,286,860 | $1,216,303 |
| SP/LP: | 100.9% | 100.8% | 100.7% |
| Days on Market: | 48 | 50 | 55 |
The median sales price for single-family, re-sale rose 11.2% in March from
February. It was up 1.6% year-over-year.
The average sales price for single-family, re-sale homes was up 7.4%
month-over-month. Year-over-year, it was down 4.7%.
Sales of single-family, re-sale homes rose 9.5% year-over-year. There were 162
homes sold in San Francisco last month. The average since 2000 is 214.
The median sales price for
condos/lofts
was up 21.4% year-over-year.
The average sales price was up 21% year-over-year.
Sales of
condos/lofts
fell 43.2% year-over-year. There were 137
condos/lofts
sold last month. The average since 2000 is 230.
The sales price to list price ratio, or what buyers are paying over what sellers
are asking, rose from 105.7% to 107.4% for homes. The ratio for condos/townhomes
rose from 100.8% to 100.9%.
Average days on market, or the time from when a property is listed to when it
goes into contract, was 25 for homes and 48 for condos/lofts.
Sales momentum…
for homes rose from –21 to –14.9. Sales momentum for condos/lofts was down 0.2
of a point to –32.4.
Pricing momentum…
for single-family homes rose 1.7 points to –6.4.
Pricing momentum for condos/lofts rose 2.8 points to –2.
Our momentum statistics are based on 12-month moving averages to eliminate
monthly and seasonal variations.
If you are planning on selling your property, call me for a free comparative
market analysis.
momentum by using a 12-month moving average to eliminate seasonality. By comparing this year's 12-month moving average to last year's, we get a percentage showing market momentum.
the blue area shows momentum for home sales while the red line shows momentum for pending sales of single-family, re-sale homes. The purple line shows momentum for the average price.
As you can see, pricing momentum has an inverse relationship to sales momentum.
The graph below shows the median and average prices plus unit sales for homes.

Remember, the real estate market is a matter of neighborhoods and houses. No two are the same. For complete information on a particular neighborhood or property, call me.
P.S. The FHA requires all condo projects to be re-certified before they will make a loan. To find out if the condo project you're interested in is eligible, go here: https://entp.hud.gov/idapp/html/condlook.cfm.


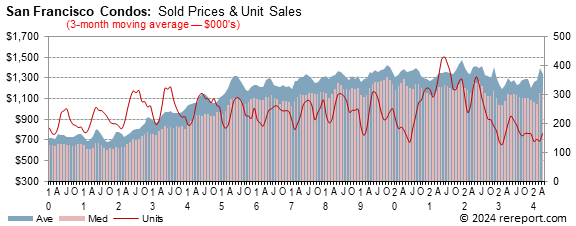
The graph below shows the median and average prices plus unit sales for condos/lofts.
The real estate market is very hard to generalize. It is a market made up of many micro markets. For complete information on a particular neighborhood or property, call me.
If I can help you devise a strategy, call or click the buying or selling link in the menu to the left.
Complete monthly sales statistics for San Francisco are below. Monthly graphs are available for each area in the city.
| March Sales Statistics | |||||||||||
| (Single-family Homes) | |||||||||||
| Prices | Unit | Yearly Change | Monthly Change | ||||||||
| Median | Average | Sales | DOM | SP/LP | Median | Average | Sales | Median | Average | Sales | |
| San Francisco | $1,725,000 | $2,173,925 | 162 | 25 | 107.4% | 1.6% | -4.7% | 9.5% | 11.2% | 7.4% | 27.6% |
| D1: Northwest | $2,273,750 | $2,596,250 | 18 | 7 | 110.8% | -16.0% | -14.0% | 28.6% | 31.8% | -8.7% | 125.0% |
| D2: Central West | $1,550,000 | $1,616,224 | 29 | 21 | 113.4% | -3.1% | -4.3% | 16.0% | 13.1% | 13.3% | 26.1% |
| D3: Southwest | $1,550,000 | $1,419,791 | 13 | 26 | 111.0% | 8.3% | -4.9% | 8.3% | 33.6% | -5.4% | 44.4% |
| D4: Twin Peaks | $1,915,000 | $2,151,318 | 22 | 17 | 108.6% | -2.7% | 0.5% | 4.8% | 7.1% | 16.2% | 57.1% |
| D5: Central | $2,697,500 | $2,819,923 | 26 | 37 | 105.8% | 3.8% | 3.4% | 36.8% | 16.0% | 12.7% | 23.8% |
| D6: Central North | $3,950,000 | $3,736,296 | 3 | 22 | 103.4% | n/a | n/a | n/a | 17.1% | 10.8% | 50.0% |
| D7: North | $4,275,500 | $4,845,100 | 10 | 22 | 104.1% | -28.1% | -53.7% | 100.0% | -10.9% | 3.8% | 11.1% |
| D8: Northeast | $1,298,000 | $2,024,838 | 5 | 24 | 97.4% | -78.5% | -66.4% | 150.0% | -53.0% | -27.2% | 25.0% |
| D9: Central East | $1,695,000 | $1,929,615 | 13 | 22 | 105.6% | 4.3% | 0.6% | -31.6% | 11.0% | 16.4% | -18.8% |
| D10: Southeast | $1,100,000 | $1,069,543 | 23 | 35 | 105.9% | 4.8% | -2.0% | -47.7% | 3.0% | -2.8% | 9.5% |
| March Sales Statistics | |||||||||||
| (Condos/TICs/Co-ops/Lofts) | |||||||||||
| Prices | Unit | Yearly Change | Monthly Change | ||||||||
| Median | Average | Sales | DOM | SP/LP | Median | Average | Sales | Median | Average | Sales | |
| San Francisco | $1,305,000 | $1,471,513 | 137 | 48 | 100.9% | 21.4% | 21.0% | -43.2% | 22.2% | 14.3% | -16.5% |
| D1: Northwest | $1,382,000 | $1,390,500 | 4 | 33 | 101.6% | 26.8% | 13.0% | -75.0% | 72.8% | 73.8% | 300.0% |
| D2: Central West | $1,440,000 | $1,306,760 | 5 | 41 | 100.2% | 55.7% | 38.2% | -28.6% | 92.3% | 22.8% | 66.7% |
| D3: Southwest | $678,000 | $678,000 | 2 | 16 | 103.1% | 15.9% | -25.1% | -60.0% | -32.2% | -32.2% | 100.0% |
| D4: Twin Peaks | $823,500 | $703,500 | 3 | 71 | 96.0% | -27.9% | -35.9% | -25.0% | -10.4% | -30.4% | -25.0% |
| D5: Central | $1,343,500 | $1,463,176 | 34 | 24 | 105.5% | -7.3% | 0.8% | -20.9% | -1.2% | 10.5% | -2.9% |
| D6: Central North | $1,130,000 | $1,166,179 | 13 | 37 | 100.9% | -23.1% | -20.9% | -53.6% | 17.4% | 9.9% | 8.3% |
| D7: North | $1,693,500 | $1,768,250 | 18 | 38 | 100.2% | 7.7% | -15.3% | -35.7% | -0.1% | -8.2% | 20.0% |
| D8: Northeast | $1,227,500 | $1,242,897 | 34 | 50 | 98.9% | 25.4% | 22.2% | -20.9% | 25.1% | 26.8% | 13.3% |
| D9: Central East | $977,500 | $1,140,716 | 66 | 58 | 99.5% | -0.1% | 6.5% | -1.5% | -9.1% | -21.0% | 20.0% |
| D10: Southeast | $479,000 | $589,927 | 6 | 84 | 101.9% | -31.4% | -22.0% | -33.3% | -20.0% | -8.4% | -25.0% |
Mar. 29, 2024 --
The end of the first quarter of 2024 has come, and it is expected to be near the
end of the second quarter before the first change in the federal funds rate
occurs. Of late, investors seem to have somewhat less conviction than they had
that lower rates will come in about three months' time; futures markets
investors presently reckon just a 60% chance that the initial cut in rates will
come in June.
At least for new home sales, the early spring housing season has started on a
flat foot, or at least a little changed one. To be fair, February's really a
pretty early start, but with housing markets as competitive as they have been,
the most aggressive buyers are likely out in the market already. For February,
the Census bureau reported that sales of new homes came in at a 662,000 annual
pace, down just slightly from an (upwardly) revised 664,000 January rate. Of
course, the 0.3% monthly decline may actually be revised away just as was
January's initially-reported monthly decline. What won't likely be revised away
is that there are plenty of newly-constructed homes available to buy, an
annualized 463,000 units, good enough to be an 8.4 month supply at the present
rate of sale. To keep new homes moving, builders have been using incentives and
price discounts; in February, the median price of a newly-built home was
$400,500, down 7.6% from last February. Unlike existing home prices, which are
high and likely to set new records again this spring, new home prices have
actually retreated for a while, with the current median cost about 19% below
October 2022's peak ($496,800) mark.
The pretty flat pace for new home sales in February was more or less matched by
a modest increase in signed contracts to purchase existing homes. The National
Association of Realtors Pending Home Sales Index posted a 1.6% increase in
February; in turn, and provided the offers make it all the way to closing, this
may help lift existing home sales for March but more likely April by a little
bit. Based upon the lag from a signed contract to a closing, we may see a modest
dip in March closings (recorded sales) before an uptick for April, as January's
PHSI posted a 4.7% contraction. Even with the modest February boost, the PHSI is
about 7% below year-ago levels, so housing activity remains modest at best.
With mortgage rates and home prices elevated, applications for mortgage credit
have been have been trending generally lower with occasional upward flares.
After such a flare in the week ending March 8, the next two weeks have erased
some of that gain, and in the week ending March 22 a 0.7% decline in mortgage
applications was reported by the Mortgage Bankers Association. Requests for
funds to purchase homes eased slightly, declining 0.2%, while those to refinance
existing mortgages dropped back by 1.6%. After declining more than a percentage
point from November to early-mid February, mortgage rates have been somewhat
firmer, bouncing around at levels above their recent bottom over the last few
weeks.
Unless you're impatiently waiting for lower interest rates, there's nothing at
all wrong with benign stability. The economy is performing, labor markets are
stable and high, inflation is flat and firm, but could be lower. If you hope to
see the Fed move sooner or more forcefully, we'll need to see some change -- a
faltering in labor markets, a new and faster downturn for inflation, a darkening
economic climate -- but there's little such indication that these kinds of
pronounced changes are in the offing, at least in the near term.
With this as a backdrop, all we can do is wait for the slow drip of change
that's currently occurring to get to a place where the Fed is comfortable not
only making the first change in short-term rates but also signaling that the
path ahead will include more of them. Until we get to that place, or unless
there is some other significant change in the economic or global climate, it's
hard to expect that we'll see much change to mortgage rates.
There has been little actual trend for mortgage rates for some weeks now, and we'd expect that to continue next week. At least through the end of this week, indications are that we might see a 2-3 basis point decrease in 30-year fixed mortgage rates as reported by Freddie Mac when next Thursday comes. The month and quarter has come to an end, so perhaps the new month and start of the new quarter will bring with it some change.
This page is copyrighted by https://rereport.com. All rights are reserved.