San Francisco Monthly Real Estate Market Trends
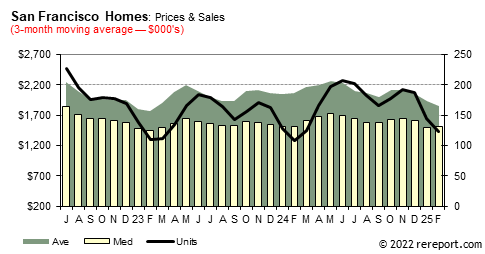
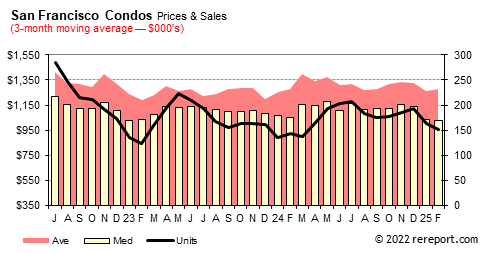
The following charts shows median and average price trends plus sales for single-family homes and
condos. The chart uses a 3-month moving average to smooth out month-to-month fluctuations yet retain seasonal
variations.
To keep on top of the market, subscribe to our free monthly
newsletter by clicking the subscribe button at the bottom right.
Detailed information on homes or neighborhoods can be had by
calling or e-mailing us. Or, fill out our Buying or Selling forms located in
the menu to the left.
DEFINITIONS
- Median Price
- Median Price is the price at which 50% of properties sold were above that
price and 50% were below.
- Average Price
- Average Price is the sum of all prices divided by the number of sales.
- DOM
- Average Days on Market is calculated from when a property was first put on
the market until it was put under contract, or taken off the market.
- SP/LP
- The average selling price divided by the average list price.
- SP/OLP
- The average selling price divided by the average original list price. This is the price the property was first
listed at, with that agent.
This page
is copyrighted by
https://rereport.com. All rights are reserved.